Next: Using EM Up: Modelling Categorical Data: Loglinear Previous: Multinomial logit models through
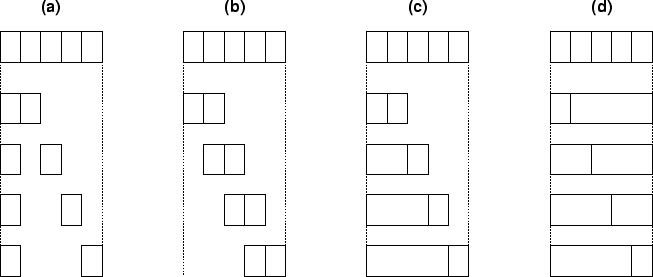
 subtables, each consisting of an adjacent pair. Thus we end up
with a table with one binary variable, and an extra dimension
with categories. That is, an
subtables, each consisting of an adjacent pair. Thus we end up
with a table with one binary variable, and an extra dimension
with categories. That is, an  table becomes a
 table.
   c1 c2 c3
r1 11 12 13
r2 21 22 23
r3 31 32 33
r4 41 32 43

becomes

      c1 c2 c3
l1 r1 11 12 13
   r1 21 22 23
l2 r1 21 22 23
   r1 31 32 33
l3 r1 31 32 33
   r1 41 32 43
1 0    281     becomes    1 0 0    281
1 62.5 225                1 0 62.5 225
1 125  283                1 0 125  283
1 250  202                1 0 250  202
1 500  9                  1 0 500  9
2 0    1                  1 1 0    1
2 62.5 0                  1 1 62.5 0
2 125  7                  1 1 125  7
2 250  59                 1 1 250  59
2 500  132                1 1 500  132
3 0    15                 2 0 0    1
3 62.5 17                 2 0 62.5 0
3 125  22                 2 0 125  7
3 250  38                 2 0 250  59
3 500  144                2 0 500  132
                          2 1 0    15
                          2 1 62.5 17
                          2 1 125  22
                          2 1 250  38
                          2 1 500  144
treating outcome (normal, abnormal, dead) as ordinal. The first
column is the new variable with categories, indexing the
new pairs. This can usually be done `by hand' in a text editor or a
spreadsheet, since tables are usually small enough to be convenient.
GENLOG
  outcome  BY  subtab with dose2
  /MODEL=MULTINOMIAL
  /PRINT estim   /PLOT none
  /DESIGN outcome outcome*dose2
          outcome*subtab.
where subtab is the index of the subtable.
/DESIGN = outcome outcome*dose2
          outcome*subtab
          outcome*dose2*subtab.
will allow separate effects.
    DOSE  OUTCOME    COUNT   SUBTAB

    0        1      281        1   * row 1
   62.5      1      225        1
  125        1      283        1
  250        1      202        1
  500        1        9        1
    0        2        1        1   * row 2
   62.5      2        0        1
  125        2        7        1
  250        2       59        1
  500        2      132        1
    0        1      282        2   * row 1 + row 2
   62.5      1      225        2
  125        1      290        2
  250        1      261        2
  500        1      141        2
    0        2       15        2   * row 3
   62.5      2       17        2
  125        2       22        2
  250        2       38        2
  500        2      144        2
 combined. The file
mice-auto.sps
gives an example of doing this automatically within SPSS.
combined. The file
mice-auto.sps
gives an example of doing this automatically within SPSS.
Loglinear Analysis Unit 8
 |
| ||||||||