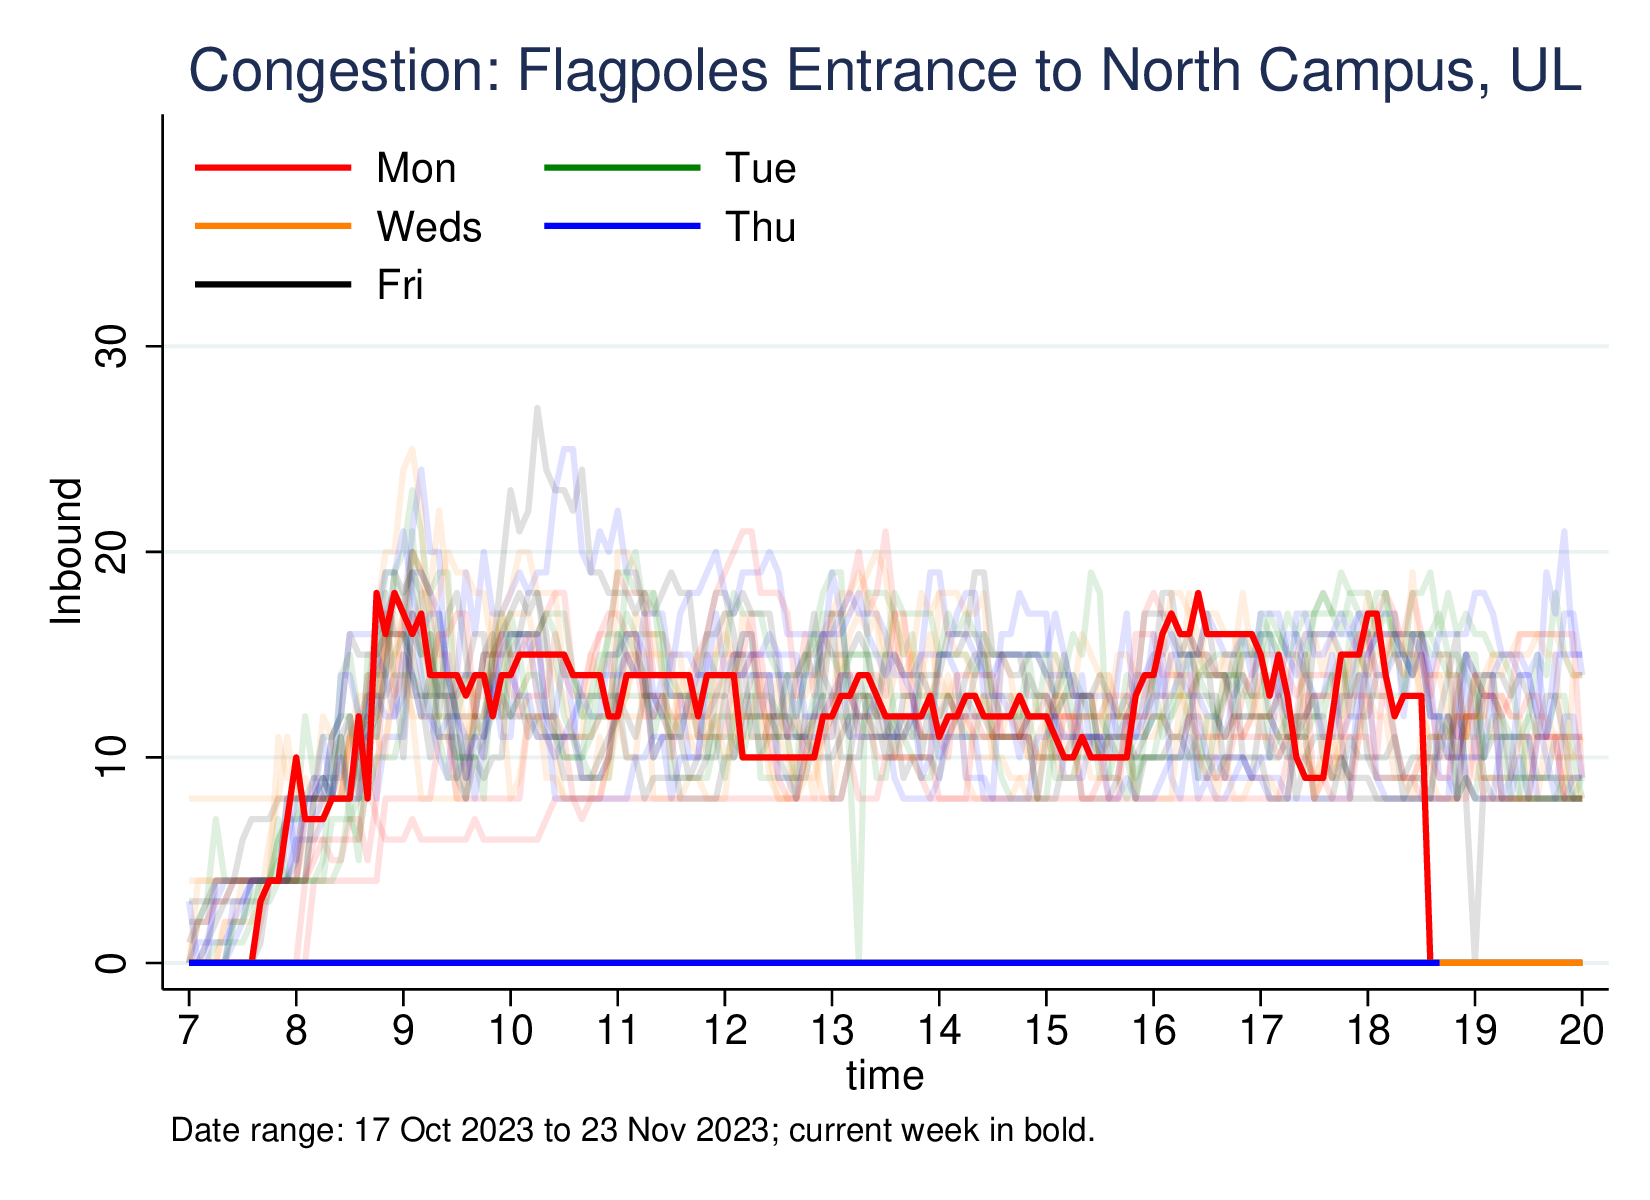
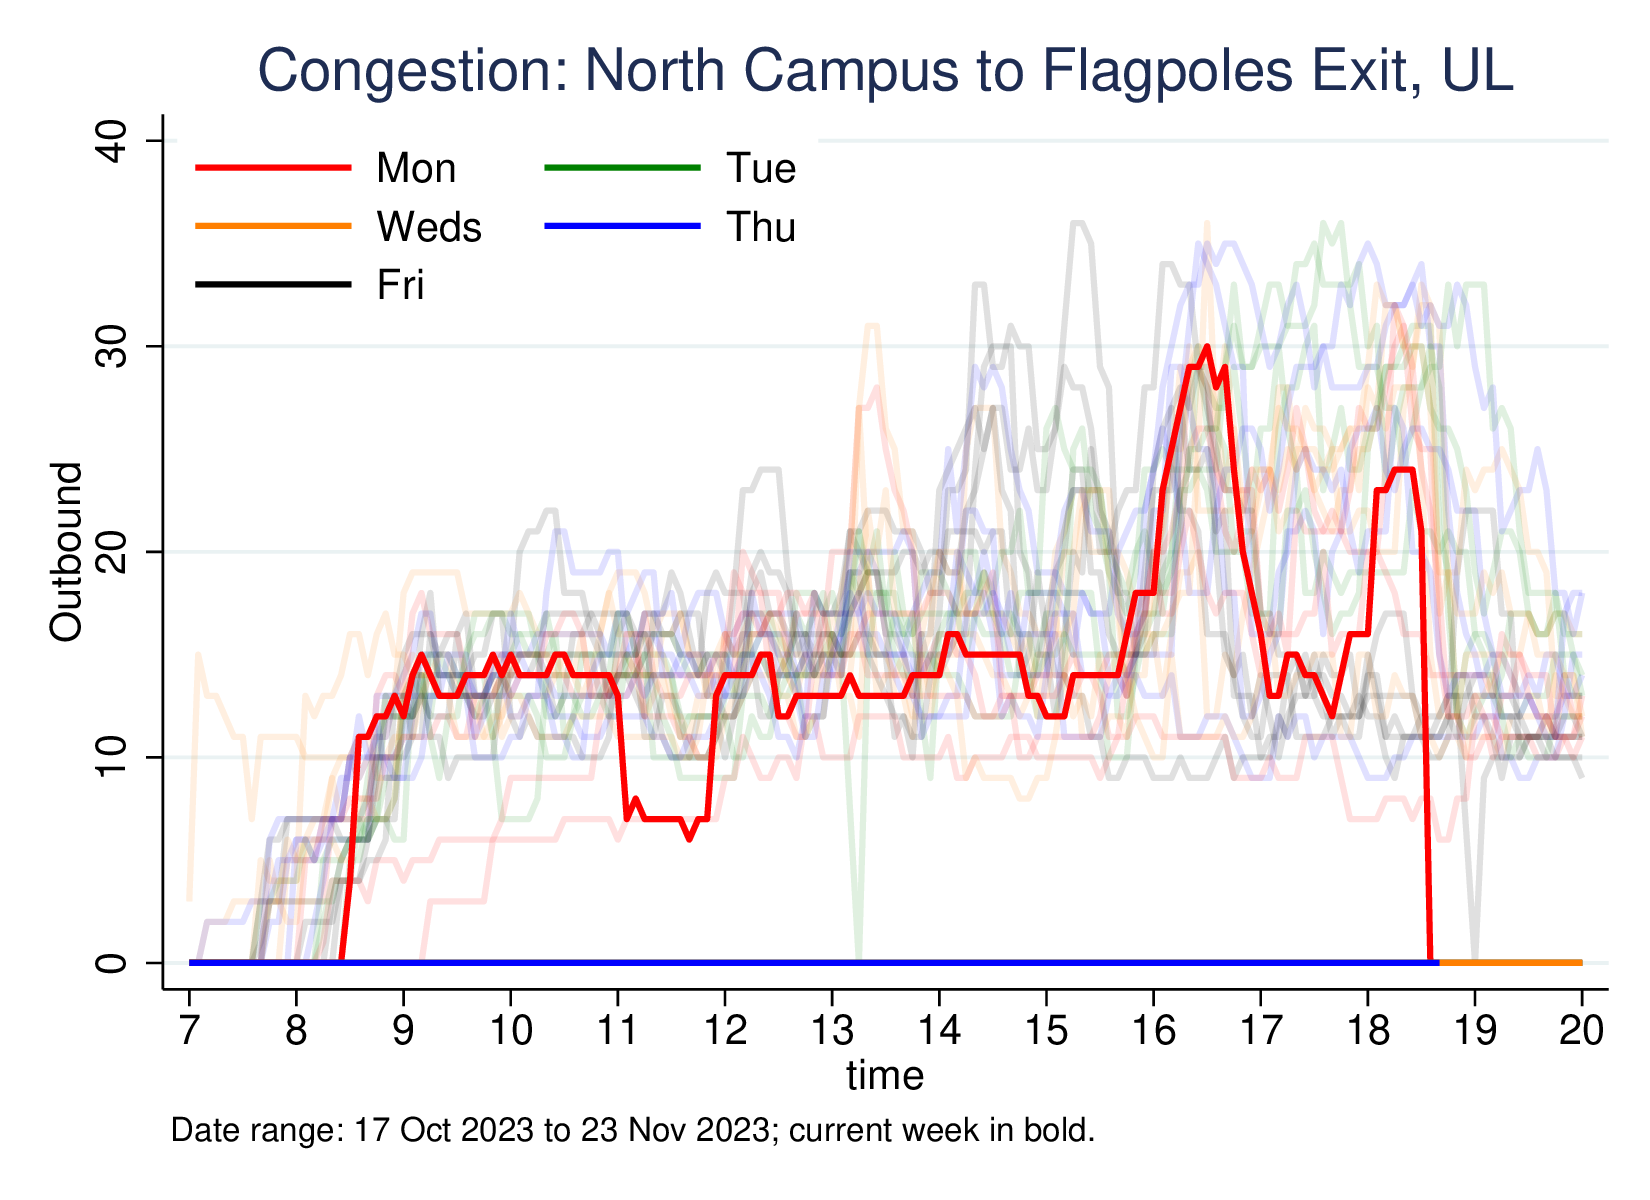
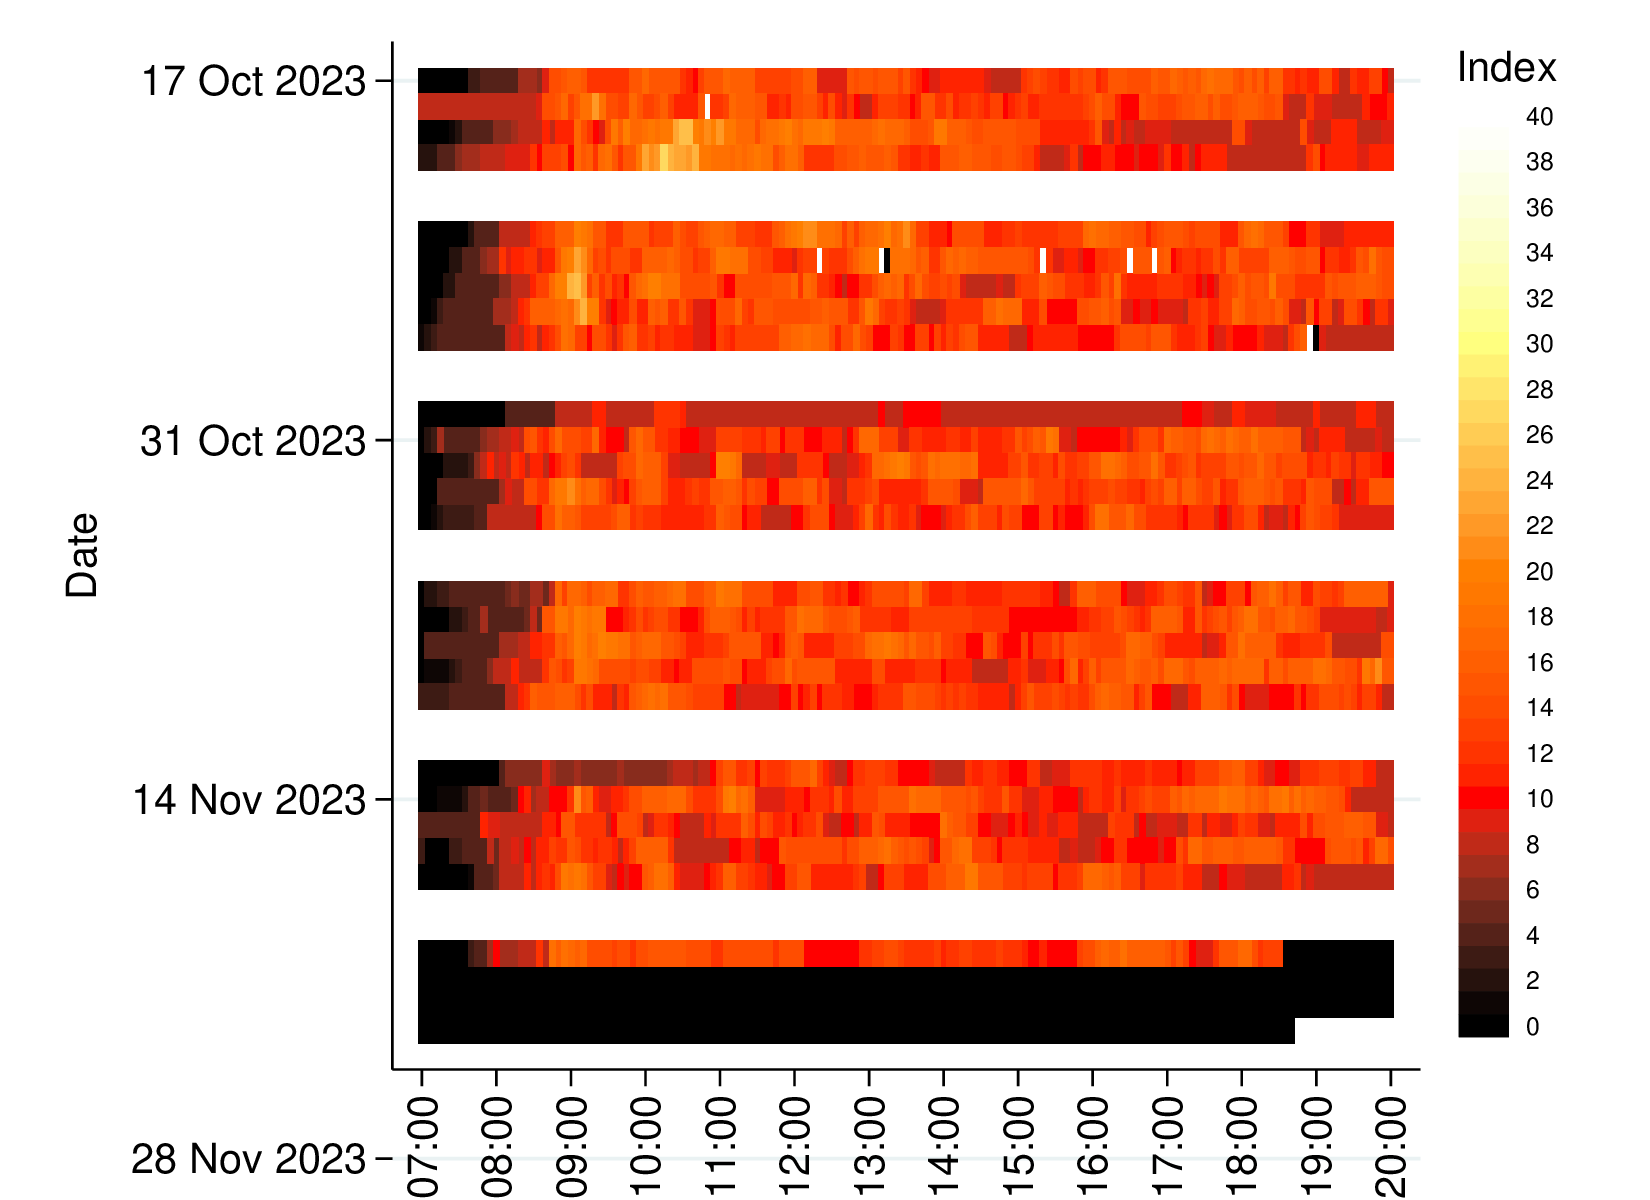
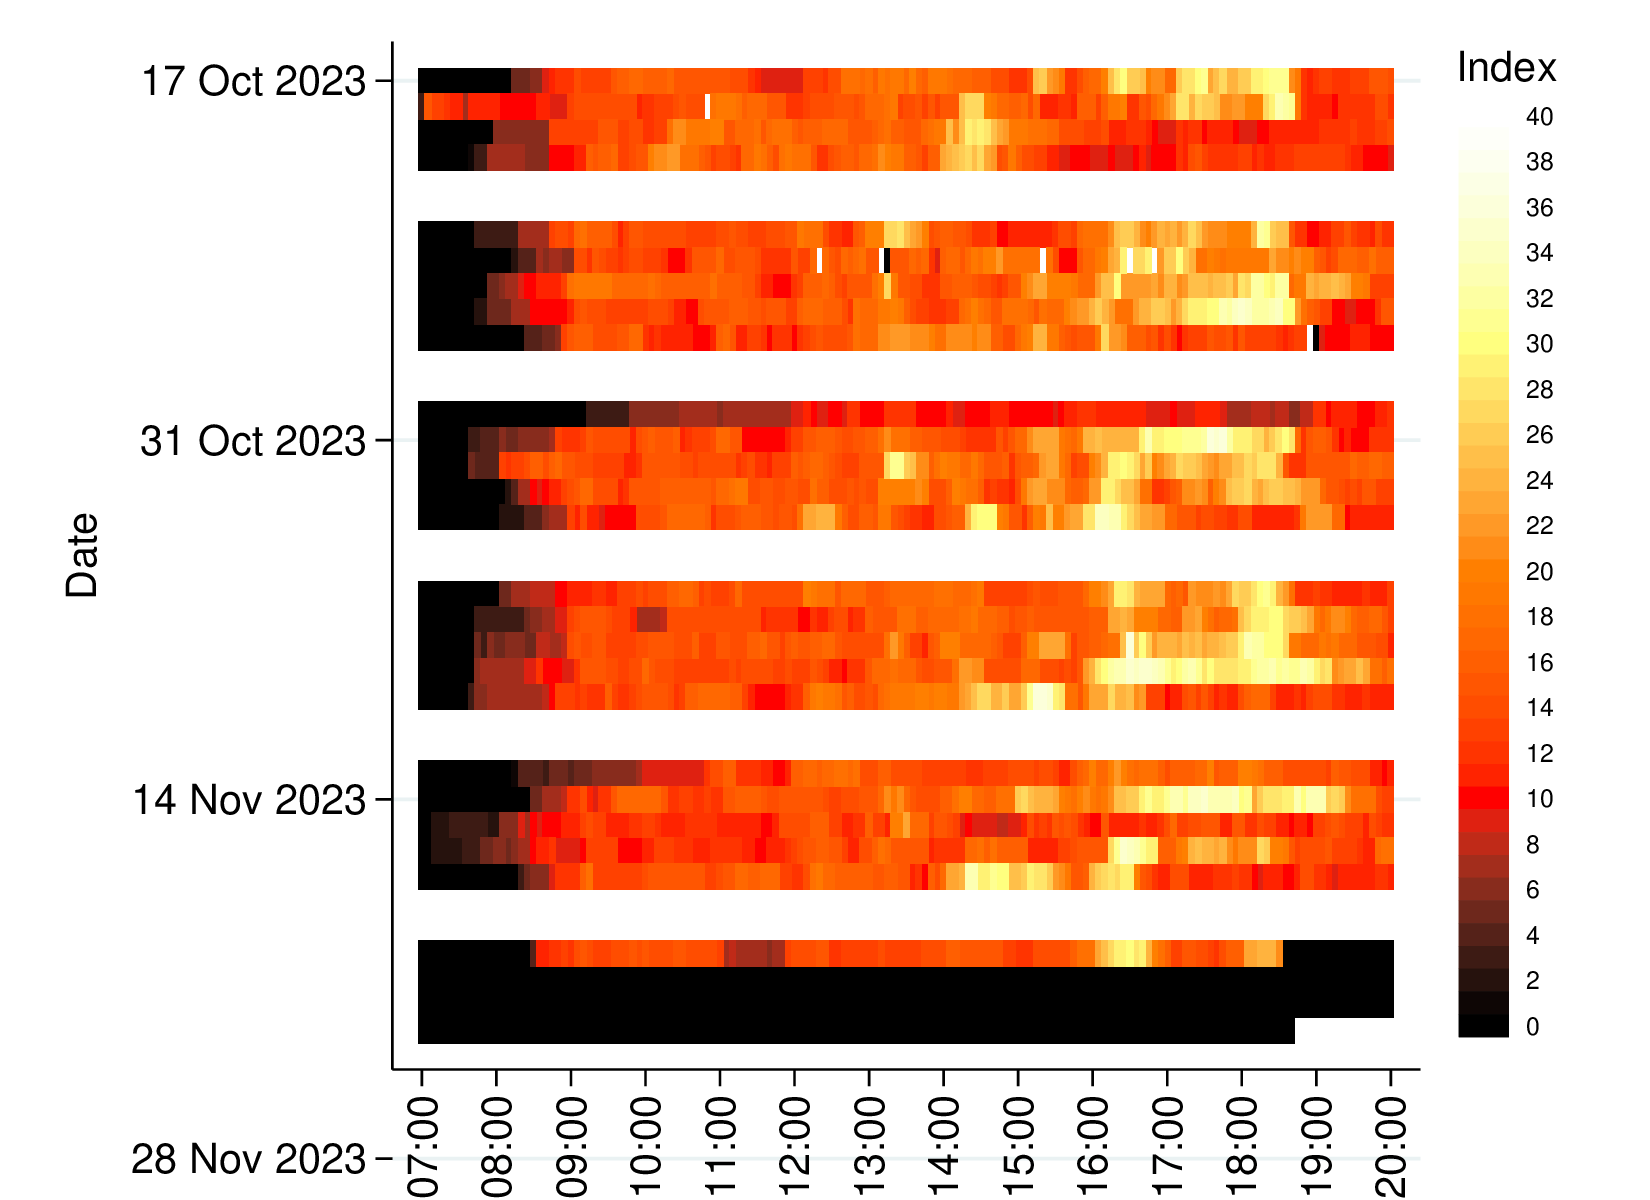
These graphs estimate traffic levels in UL using Google Maps' traffic layer. Ten points on a route from the flagpoles entrance to just north of the boat club/north campus roundabout are sampled at five minute intervals, in both directions. Each point is scored between 0 (white) and 4 (brown) according to the Google traffic indication. These are summed to arrive at a congestion score for each direction, with a possible range from 0 to 40.
Spring 2018/9 graphs