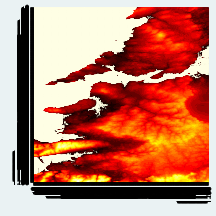
Elevation data for large swathes of the planet have been collected by NASA and are available to download from http://dds.cr.usgs.gov/srtm/.
The data is contained in binary files, each representing a 1-degree by 1-degree “square”. Here are five lines of Python and four lines of Stata that will turn the data into a simple graph:
import struct

file = open("data/N52W011.hgt", "r")

for y in range(1201):

for x in range(1201):

print y, x, struct.unpack(">h",file.read(2))[0]
Do python file.py > map.dat. Then run this Stata code:
infile i j height using /tmp/ext.dat

gen h2 = int(sqrt(height))

replace h2 = 30 if h2<=0

hmap j i h2, nosc

(Hi-res version.)
You may need to install Python’s struct package, and Stata’s hmap add on, but they’re available from the usual locations.
There are better ways of doing this, of course: it’s slow, the aspect ratio is wrong, the colours are not ideal and the axis labelling is bad. Even worse, it is a complete abuse of the hmap add-on. It’s a quick and dirty way to turn binary data into pictures, all the same.
