In a previous note, I used Stata to simulate 2*2 tables of a one-off outcome. The simulation shows that odds ratios (ORs) are a much better estimate of the underlying causal effect or statistical association than relative rates are, given certain assumptions. One key assumption is that it is a one-off outcome, where it is reasonable to model the propensity for the event with a normal or logistic distribution. Where the outcome is the result of potentially repeated exposure to a risk (such as being ever married or ever infected with a particular pathogen) the resulting propensity is not likely to be normal. That is, if you are exposed to many opportunities to marry, saying yes once means you become ever-married for ever after, and even if the propensity to marry at a specific opportunity is normally distributed, the combined distribution of propensity to be ever-married after an unknown number of opportunities is likely not to be well-described as normal.
I simulate this in terms of a epidemic: a population is exposed to a new pathogen, and I follow infection rates forward for a time. At each step of the simulation 100 individuals are chosen at random to be exposed to the pathogen, and they succumb at two separate rates: group 1 have a 0.25 probability, and group 2 a 0.50 probability. Once infected, you stay infected for the purposes of the summary. Individuals are likely to be exposed more than once (without consequence if they are already infected), though obviously they can’t be exposed more than once in any single step. At each step, the 2*2 table is constructed, and the OR and RR calculated, and a complementary log-log model of the outcome is fitted. The code for the simulation is at http://teaching.sociology.ul.ie/catdat/infection.do.
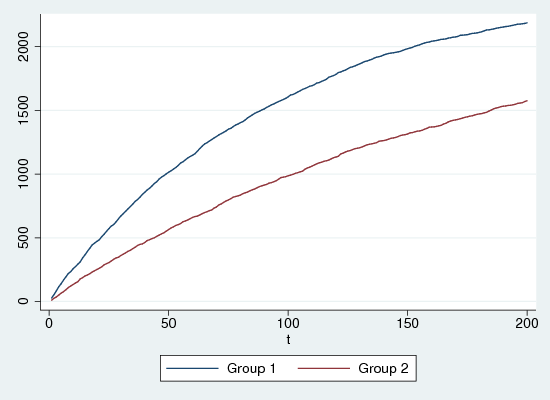
Figure 1 shows the cumulative infection rates for the two groups, for one run of the simulation, with 200 iterations in a population of 5000, half in each group. Group 1 is much more susceptible, but is beginning to show signs of saturation, as the pool of uninfected subjects gets smaller. At time 200, about 85% of group 1 and 65% of group 2 have been infected, and this varies little across the multiple runs.
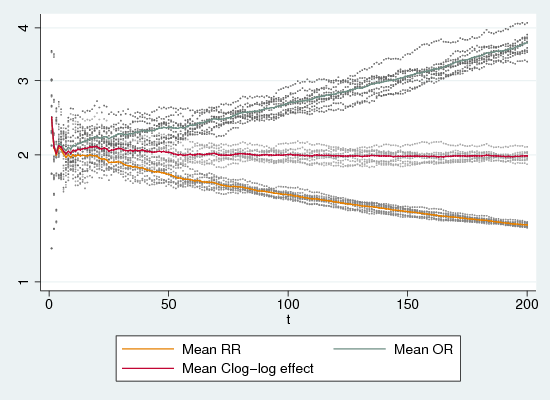
Figure 2 shows odds-ratios and relative rates (calculated arithmetically from the 2*2 table) and c-log-log regression parameters (exponentiated) for ten replications. RRs show the same sort of behaviour as with one-off outcomes: they begin at around the correct value (after a brief unstable period) but they head steadily towards the floor of no effect (RR=1) as the infection rate rises. ORs do the opposite, but to no better effect: they steadily deviate upwards from the correct value as infection increases. Only the exponentiated complementary-log-log estimate behaves well: it quickly settles very close to the ratio of 2.0 inherent in the simulation.
The fact that the complementary-log-log model generates consisent estimates of the effect suggest that it operates as a hazard model, since the ratio of 0.5/0.25 programmed into the simulation not a ratio of simple probabilities. That is, each probability is the probability of infection conditional on not yet being infected, and is thus a discrete hazard rate, not a probability, and the ratio is a hazard rate ratio.
In passing I will note that these findings are in agreement with Pearce’s robust defence of the OR versus the RR (2004), and in agreement with the detailed arguments about using ORs, RRs and other measures to make causal inferences, of Reichenheim and Coutinho (2010), while it runs counter to the support of log-binomial and other models in preference to logistic regression, of Barros and Hirakata (2003).
Bibliography
Barros, A. J. and Hirakata, V. N. (2003).- Alternatives for logistic regression in cross-sectional studies: An empirical comparison of models that directly estimate the prevalence ratio.
BMC Medical Research Methodology, 3(21).
Pearce, N. (2004).- Effect measures in prevalence studies.
Environmental Health Perspectives, 112(10):1047-1050.
doi: 10.1289/ehp.6927.
Reichenheim, M. E. and Coutinho, E. S. F. (2010).- Measures and models for causal inference in cross-sectional studies: Arguments for the appropriateness of the prevalence odds ratio and related logistic regression.
BMC Medical Research Methodology, 10(66).

