Twitter is a goldmine of relational info. Who follows whom, who retweets whom, who replies to whom, and so on. And a lot of this data is available for analysis (though some of it is on a drip-feed). I decided to try to understand my twitter identity by looking at who the people who follow me follow.
First step is to access the data, and for this I used the twitteR R package. Initial setup involves registering with Twitter, to obtain the values I have replaced with “(secret info)” here:
library(twitteR)
consumerKey <- "(secret info)"
consumerSecret <- "(secret info)"
accessToken <- "(secret info)"
accessSecret <- "(secret info)"
setup_twitter_oauth(consumerKey, consumerSecret, accessToken, accessSecret)
Then it is reasonably straightforward to download data:
bh <- getUser("brendanthalpin")
bhfollowerIDs <- bh$getFollowers()
bhfollowerIDs now contains a list of my followers. I need to use this to build a list of lists of who they follow. This is complicated by the fact that Twitter drip-feeds this data: it is rate-limited to 15 requests per 15 minutes.
getFriendIDs() is a method on the “user” class, that gets the following list of the user in question. It fails if that user follows zero people, hence I wrap it in a try({}) block. I cope with the rate limiting by waiting for 15 minutes after every 15th request. This is unstable and fell over from time to time (requiring me to restart with
for (i in XXX:length(bhfollowerIDs))
where it stopped after XXX-1 requests).
Then I ran it overnight.
follfoll <- list()

for (i in 1:length(bhfollowerIDs)) {
  try({
    f <- bhfollowerIDs[[i]]$getFriendIDs()
    follfoll[[i]] <- f
    print(sprintf("Friends of %d done", i))
  })
  if (i %% 15 == 0) {
    print(sprintf("Sleeping after case %d", i))
    print(getCurRateLimitInfo("friends"))
    Sys.sleep(60*15+5)
  }
}
Then what to do with the data? A natural approach is to attempt to group the followers according to similarity in their following lists, and we can do that via cluster analysis and multidimensional scaling, inter alia. But first we need to define a measure of similarity or distance. A common similarity for binary data is the Jacquard measure, where similarity is the size of the intersection over the size of the union of attributes (i.e., the number of common followers divided by the number followed by at least one). I’ve used the number of common followers divided by the larger of the two numbers followed, which yields quite similar results. Both similarities are 0–1 bounded, so distances are 1 – similarity.
This code creates an N*N matrix of zeros, and fills in the two triangles with the pairwise distances.
nfoll2 <- length(follfoll)
distmat <- matrix(0, nrow=nfoll2, ncol=nfoll2)

for (i in 1:(nfoll2-1)) {
  for (j in (i+1):nfoll2) {
    print(sprintf("%d %d: ", i, j))
    a <- follfoll[[i]]
    b <- follfoll[[j]]
    len <- max(length(a),length(b))
    match <- length(intersect(a, b))
    distmat[i,j] <- (len - match)/len
    distmat[j,i] <- distmat[i,j]
  }
}
Further analysis requires this pairwise distance matrix to be tidied. It is useful to label the data with the username and number of tweets:
followerNtweets <- sapply(bhfollowerIDs[1:nfoll2], FUN=function(user) user$statusesCount)
screennames     <- sapply(bhfollowerIDs[1:nfoll2], FUN=function(user) user$screenName)
rownames(distmat) <- paste(followerNtweets, screennames, sep=" ")
The matrix also contains cases where there were no people followed, or where the information failed to download, and these cases need to be dropped. These cases have a following list of length 0.
test <- sapply(follfoll, length) != 0
dm2 <- distmat[test,test]
Hierarchical cluster analysis produces a dendrogram or tree-structure, by incrementally grouping cases and groups that are closest to each other.
library(cluster)
cl <- agnes(dm2)
plot(cl,which.plots=2)
dev.copy(png,'followerdendro.png')
dev.off()

Another way of considering the structure of a matrix of pairwise distances is multidimensional scaling. We can imagine that the pairwise distances imply a multidimensional space within which the cases are located, and use any of a variety of algorithms to see if we can approximate this structure in a reasonably small number of dimensions.
fit <- cmdscale(dm2, eig=TRUE, k=2)
x <- fit$points[,1]
y <- fit$points[,2]
library(ggplot2)
ggplot(data.frame(x=x,y=y),aes(y=y,x=x))+geom_text(label=rownames(dm2),size=2.5)
ggsave("mdsbhfol.png")
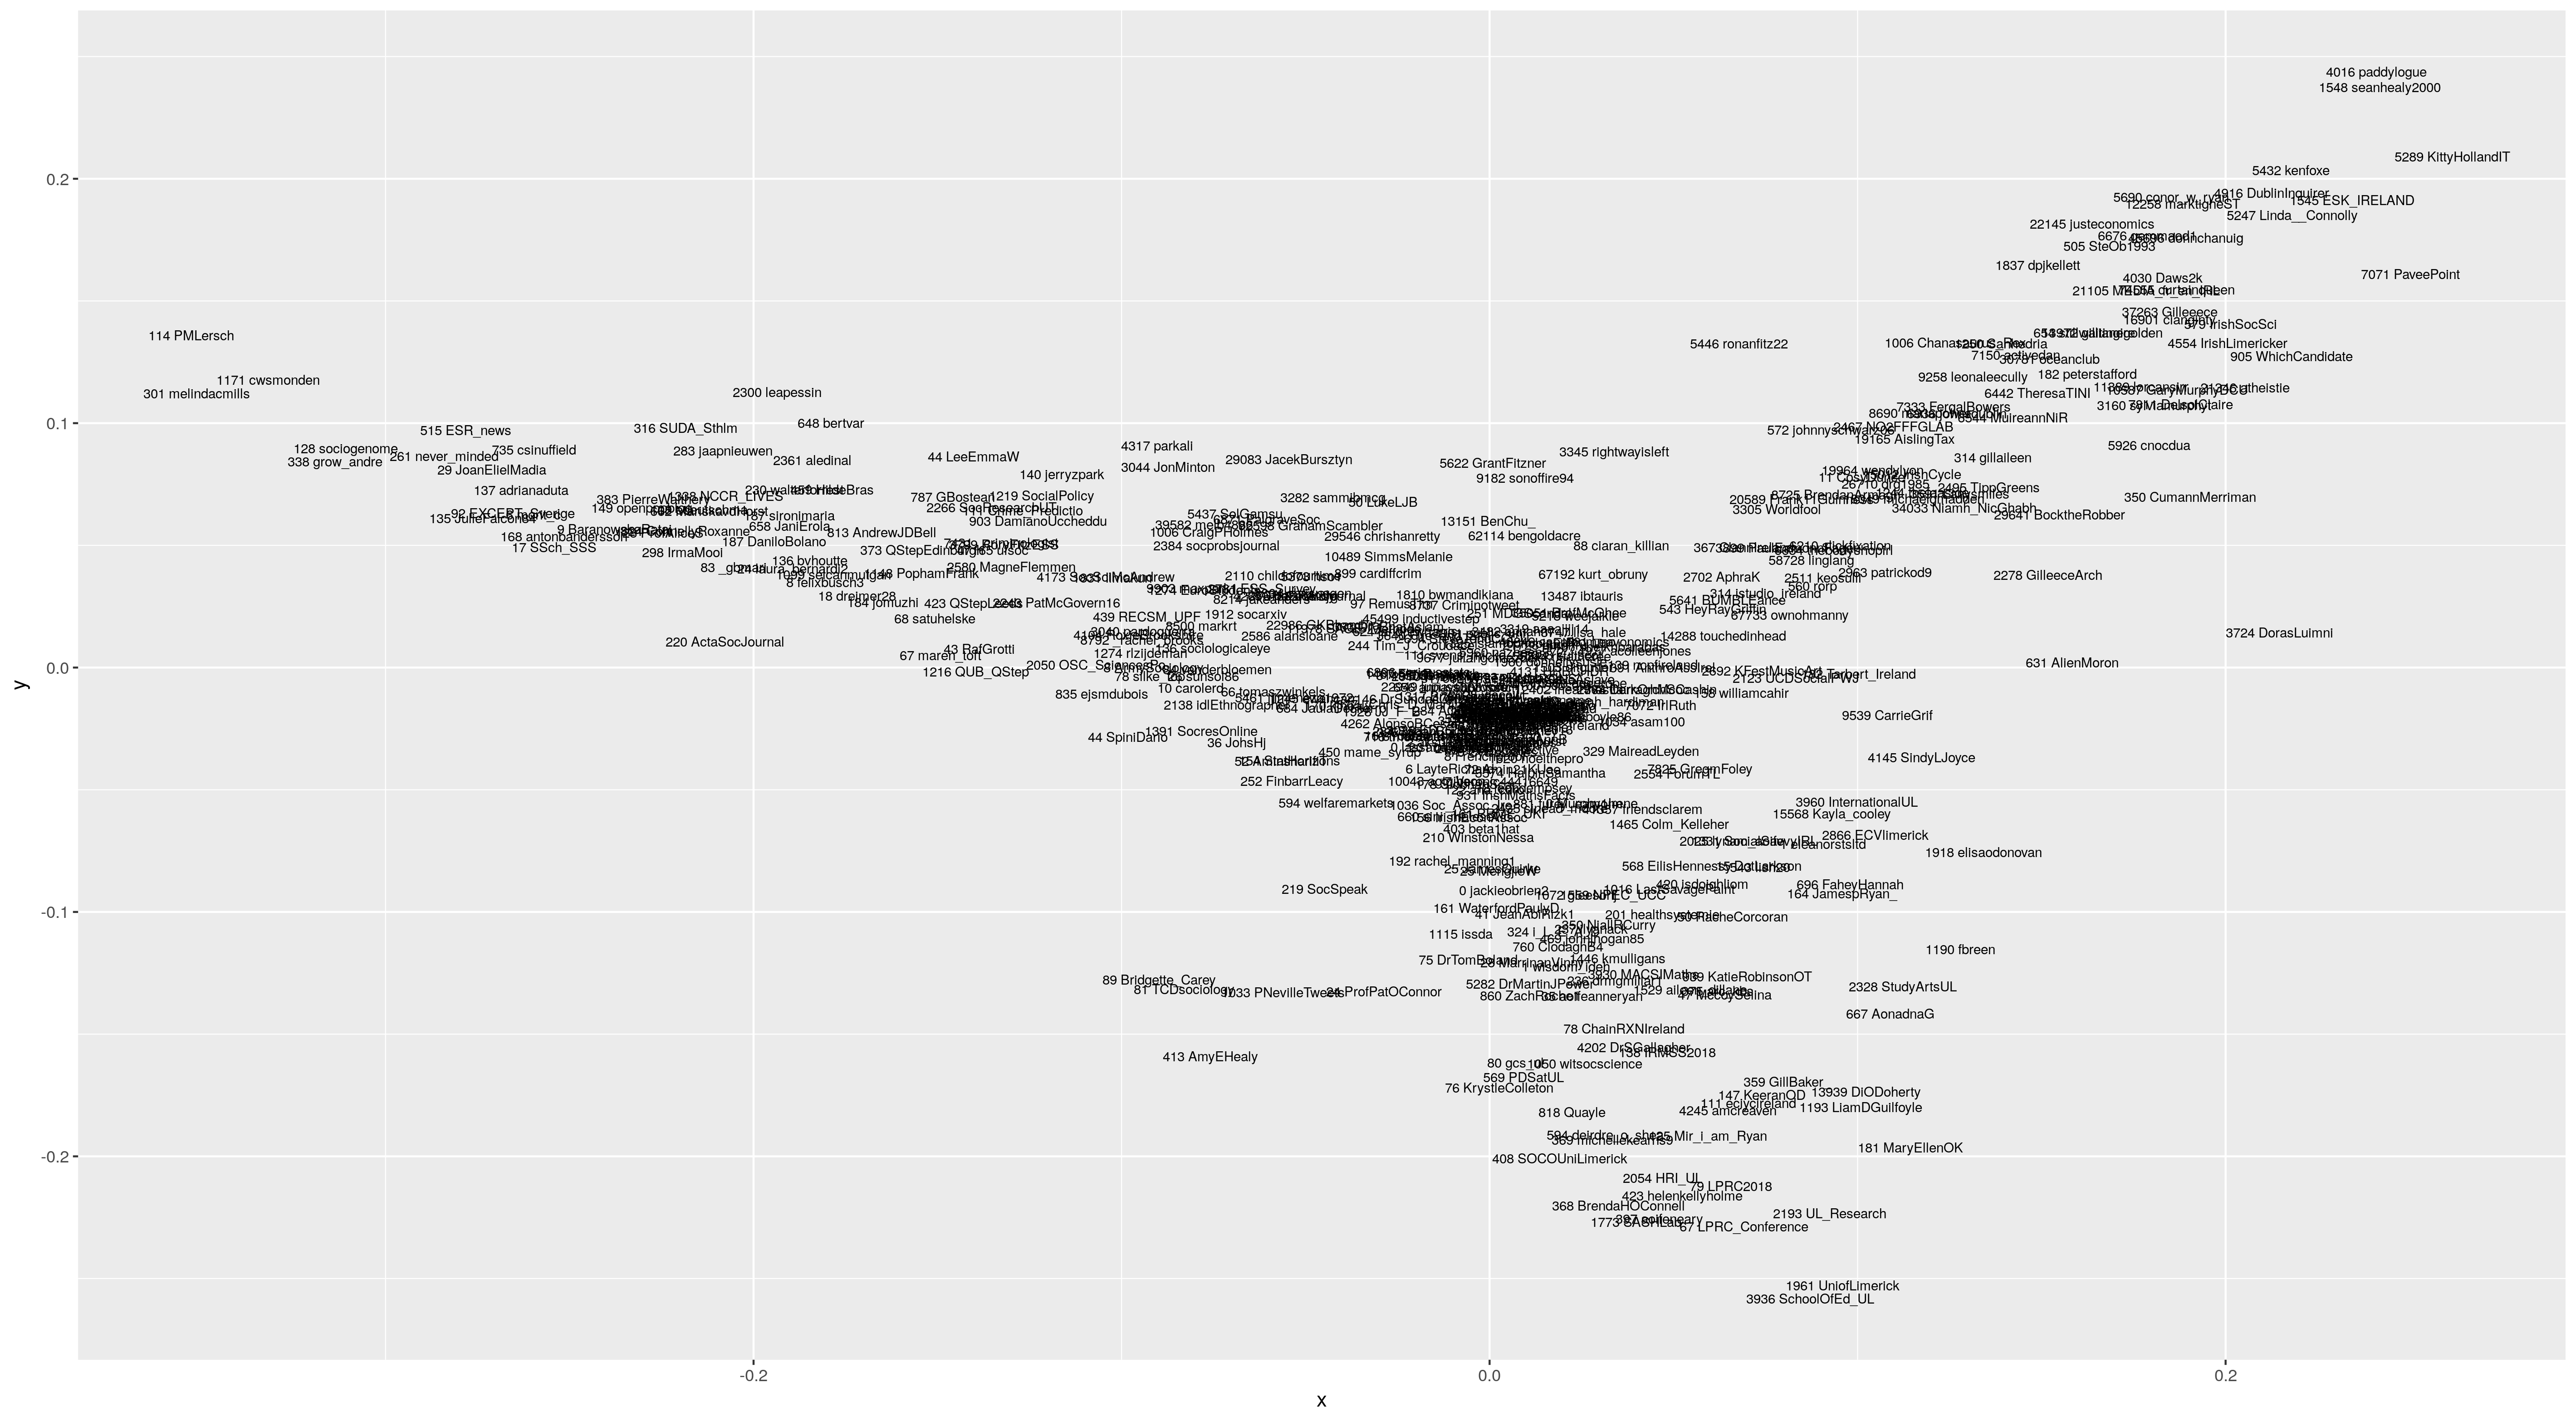
Looking at this I see a lot of structure. There are three distinct wings, one mostly related to the University of Limerick (downwards), one more national/political/left-ish (right and up, terminating in @KittyHolandIT and @SeanHealy2000) and one related to European and British quantitative social science (left). I wouldn’t put too much weight in the exact results, as it may well be that two dimensions do not capture the structure fully, and that alternative distance measures would draw out different pictures (the Jacquard distance produces very similar results; use distmat[i,j] <- 1 - match/length(union(a,b)) instead of distmat[i,j] <- (len - match)/len).