Simulating 3-way choice
I’ve been thinking about a potential second Brexit referendum, where a three-option menu is given:
- 1: Exit the EU with no deal
- 2: Accept the negotiated deal
- 3: Remain in the EU
Three-way choices are alien to British experience of referendums, but don’t really pose great difficulties. First Past The Post (FPTP) is clearly undesirable, but instant runoff (IRV) and Condorcet voting are easy to implement and explain to the electorate. So I built a little simulation to help me understand the problem, particularly to look at the relative performance of IRV and Condorcet.
My conclusions in brief: Condorcet is much more likely to go for the compromise solution (the deal), IRV less so and FPTP the least. Condorcet also seems to correspond well with the average of the underlying utilities. When the population is skewed pro-leave or pro-remain, IRV and Condorcet give more similar results (because it becomes more of a two-horse race). Condorcet cycles are rare. Finally, FPTP is crap.
Modelling voters and voting
I model voters as having preferences for, on the one hand, independence from the EU and, on the other, the avoidance of economic damage. Let “No-Deal” score 100 on the independence scale but 0 on avoidance of damage scale, and “Remain” 0 and 100 respectively. Whether the “Deal” is attractive depends on what it offers, and what voter preferences are, but clearly if it manages to be high on independence and high on avoidance of economic damage, it will be widely popular, and if it offers both a vassal state and economic collapse no one will like it much.
For a three-way choice, IRV is straightforward. Each voter expresses a first and second preference (the third is redundant). First preferences are tallied, and the smallest category is “eliminated”. The second preferences for the eliminated category are then counted and added to the first preferences, yielding a result, where the category with the higher combined total is the winner.
Condorcet voting involves looking at all two-way contests. First for options A and B, count first preferences, and second preferences of those voting C. Do the same for A and C, and for B and C. IRV looks at only one of these three pairs, chosen by eliminating the category with the lowest first preferences, but Condorcet looks at all pairs, and the winner is the category that beats the other two. As a result, it can differ from IRV, but it can also fail to yield a result: A might beat B when excluding C, B might beat C, but C might beat A. The latter phenomenon is called a Condorcet cycle, and can happen in practice but is quite rare.
Simulating the system: Modelling preferences
I model preferences as utility functions, where there is an individually-variable trade-off between independence, and avoiding economic damage. Thus for each individual the three options can be ranked (I add a small random component, to avoid determinism). Whether they prefer no-deal or remain will be fixed for each individual, but how they respond to a deal that is intermediate between the two depends on the characteristics of the deal and their personal preferences.
Let’s visualise it. Assuming the population is evenly divided in how strongly they favour independence versus avoiding damage, and with a deal which is 50% on each dimension:
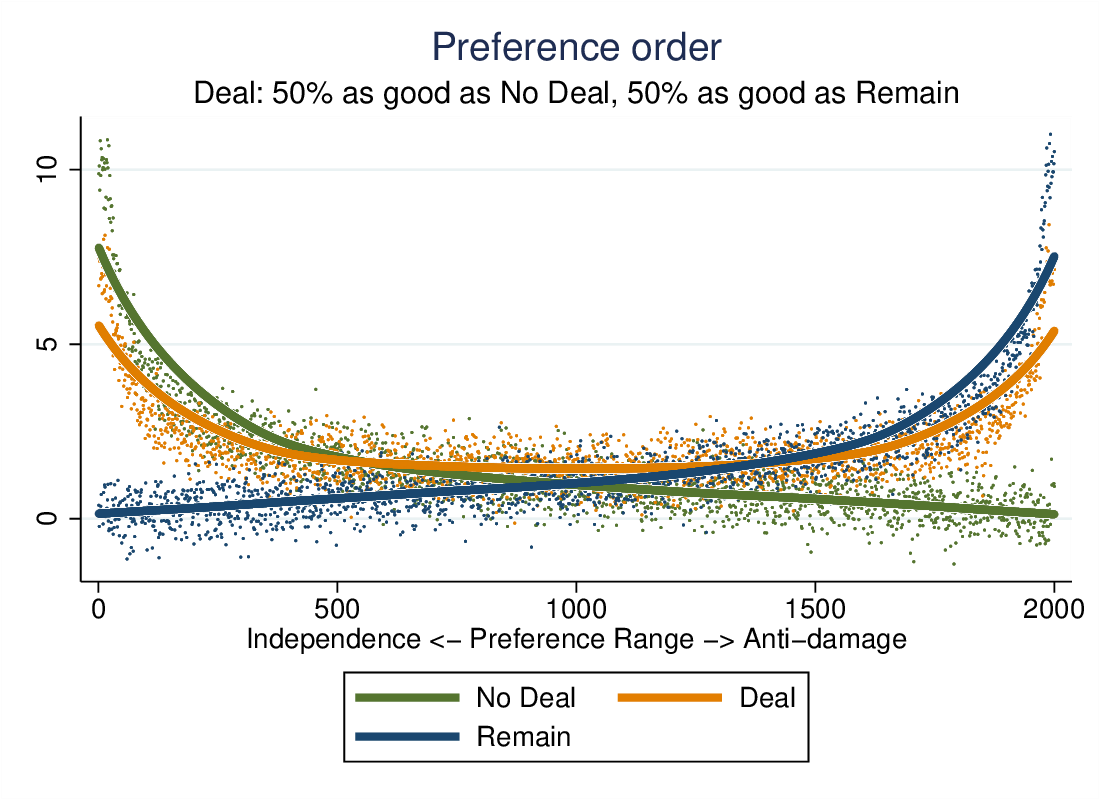
Voters are ordered from eurosceptic to europhile on the x-axis, and the dots are their “utilities” of the three outcomes. The lines locally average these utilities. The more eurosceptic voters favour no-deal, the europhiles favour remain, but a large segment in the middle favour the compromise deal. (The actual values of the utilities do not matter so much as the ordering they generate for each individual.)
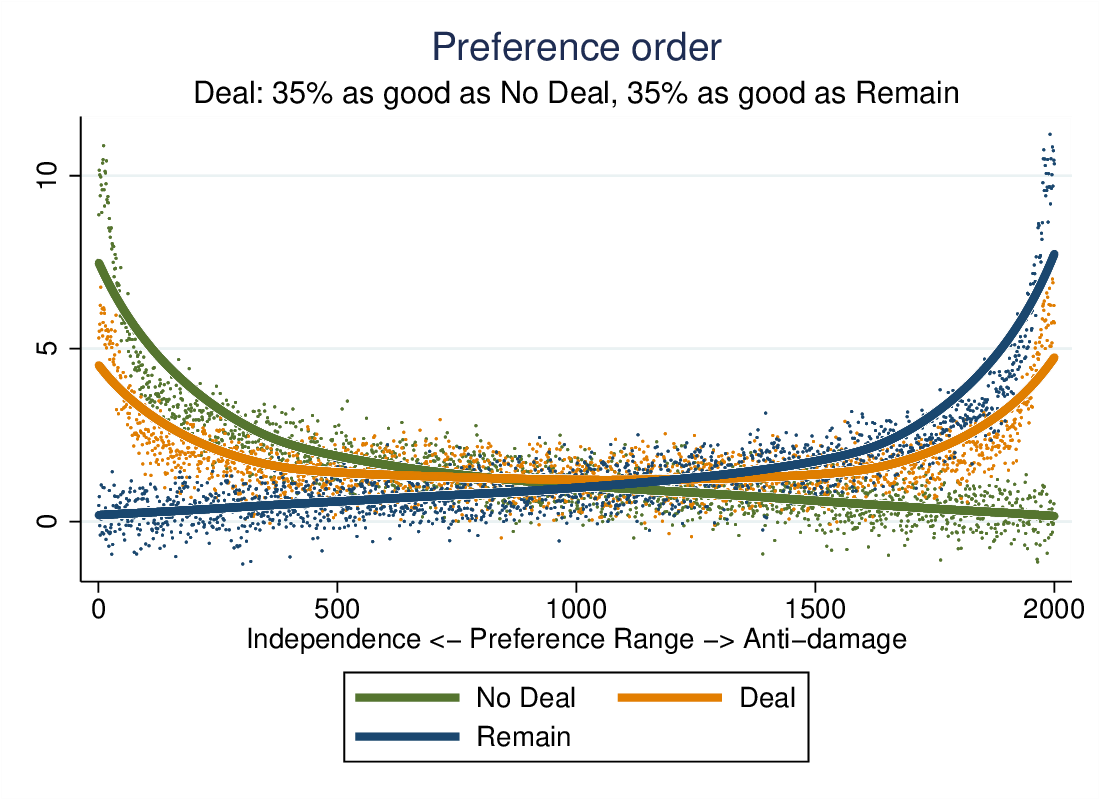
If we make the deal less attractive, so that it yields less independence and does more damage, it is less popular. Indeed, it is only the most popular option for a small band in the middle.
If the population is not evenly distributed, the story changes accordingly. Assume a strong eurosceptic skew:
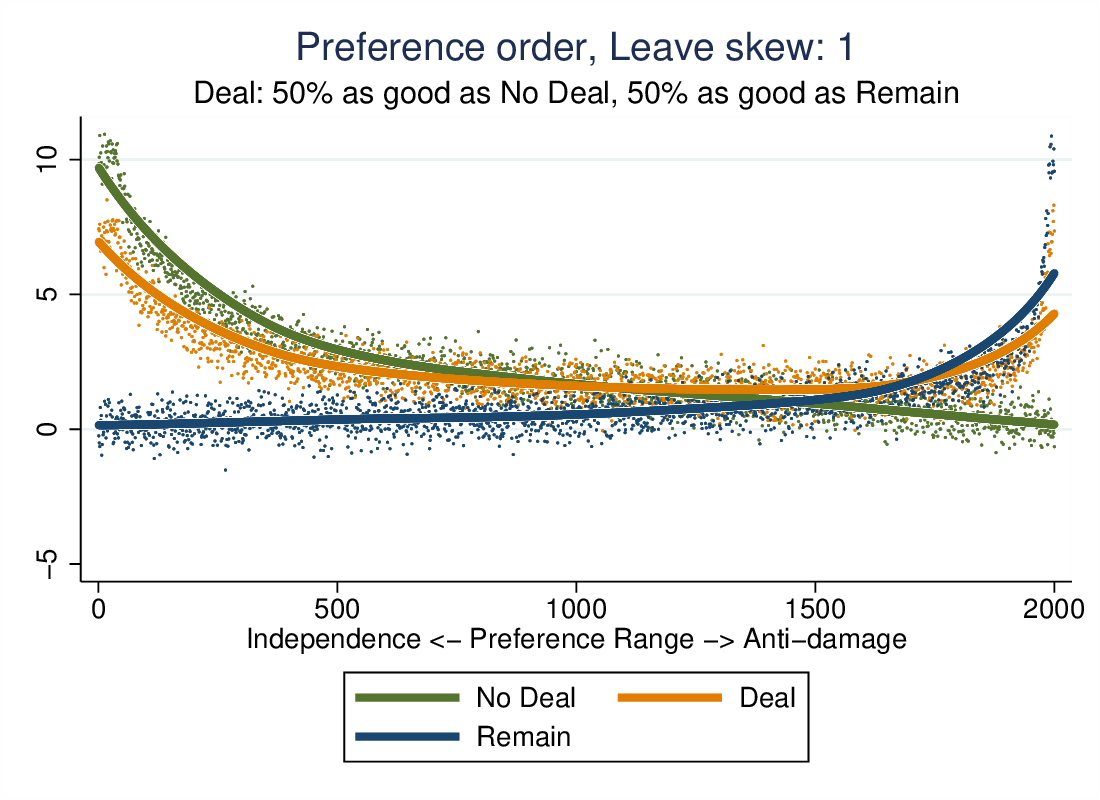
No deal looks like it might have an absolute majority in this graph, with relatively few favouring either the deal or remain. We can skew the population in the other direction with symmetric results.
If the characteristics of the deal are skewed, for instance, offering lots of independence but also lots of damage, its popularity will be skewed.
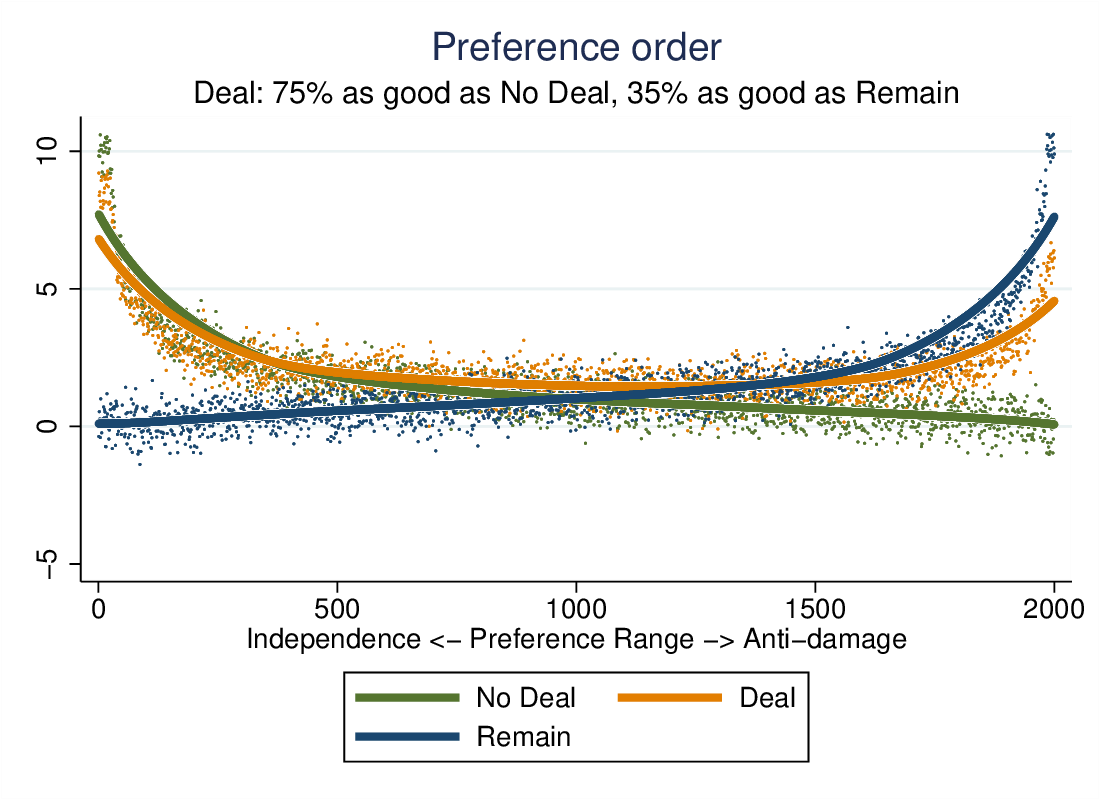
Here it does quite well, popular with the eurosceptics and competing strongly with no-deal.
Voting and counting
Here we work through an example. 1000 simulated voters mark their first and second preferences, tallied as so:
           |             2 choice
  1 choice |         1          2          3 |     Total
-----------+---------------------------------+----------
         1 |         0        335         93 |       428
         2 |        91          0         73 |       164
         3 |        87        321          0 |       408
-----------+---------------------------------+----------
     Total |       178        656        166 |     1,000
There is no absolute majority. Under IRV, the least favoured option, in this case 2, Deal, is eliminated. We add 91 second preferences to No-Deal’s 428 first preferences to get 519 votes, and 73 to 408 to get 481 votes for Remain. No Deal wins.
Condorcet involves repeating this exercise, eliminating each category one at a time:
| 1 | 2 | 3 | |
|---|---|---|---|
| 1 | 0 | 515 | 519 |
| 2 | 485 | 0 | 499 |
| 3 | 481 | 501 | 0 |
No-deal beats Deal 515:485, and beats Remain 519:481. Deal barely beats Remain. No-Deal dominates.
In this example, IRV and Condorcet agree and Condorcet yields a clear result. Condorcet is not guaranteed to do that. Here is a run that yielded a Condorcet cycle, where no category beats the other two:
           |             2 choice
  1 choice |         1          2          3 |     Total
-----------+---------------------------------+----------
         1 |         0        317         96 |       413
         2 |        86          0        109 |       195
         3 |        93        299          0 |       392
-----------+---------------------------------+----------
     Total |       179        616        205 |     1,000
In this run, comparing A and B, A gets 413 first preferences directly, but also 93 of the people who ranked C first gave A second preference. Thus if it was an A vs B context, A would have 413 + 93 = 506 votes, and B 195 + 299 = 494. A vs C has A on 413 + 86 = 499, with C on 392 + 109 = 501. B vs C shows B with 195 + 317 = 512 vs C on 392 + 96 = 488.
So under Condorcet no one option dominates. IRV would go with option C, since B will be eliminated, and the second preferences skew to C enough to lift B above A.
Running the simulation
Let’s simulate. Repeatedly. To begin with, let’s examine how IRV, Condorcet and FPTP will select the result with an evenly distributed population, varying the characteristics of the deal, running 100 times for each combination of characteristics. In particular, how likely are voters to select the deal, as its characteristics vary? By evenly balanced, I mean that preferences are equally balanced between independence and avoidance of damage, such that a remain/no-deal two-way competition would be very close.
IRV looks as follows:
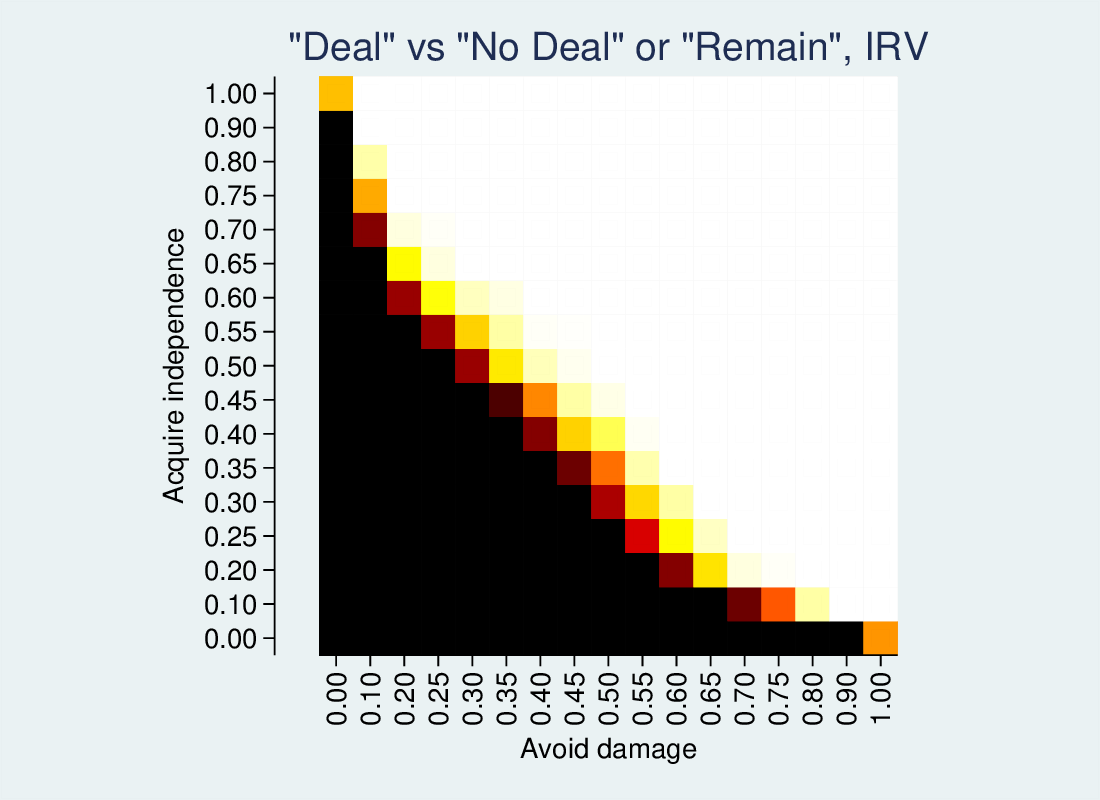
Black cells indicate the deal never wins, white that it always wins, and intermediate colours indicate how likely it is to be the winner. There is a clear good-deal/bad-deal trade off. Deals that have high independence or good avoidance of damage are popular, but if one or both option is poor, the deal will be rejected.
For comparison, Condorcet looks like this:
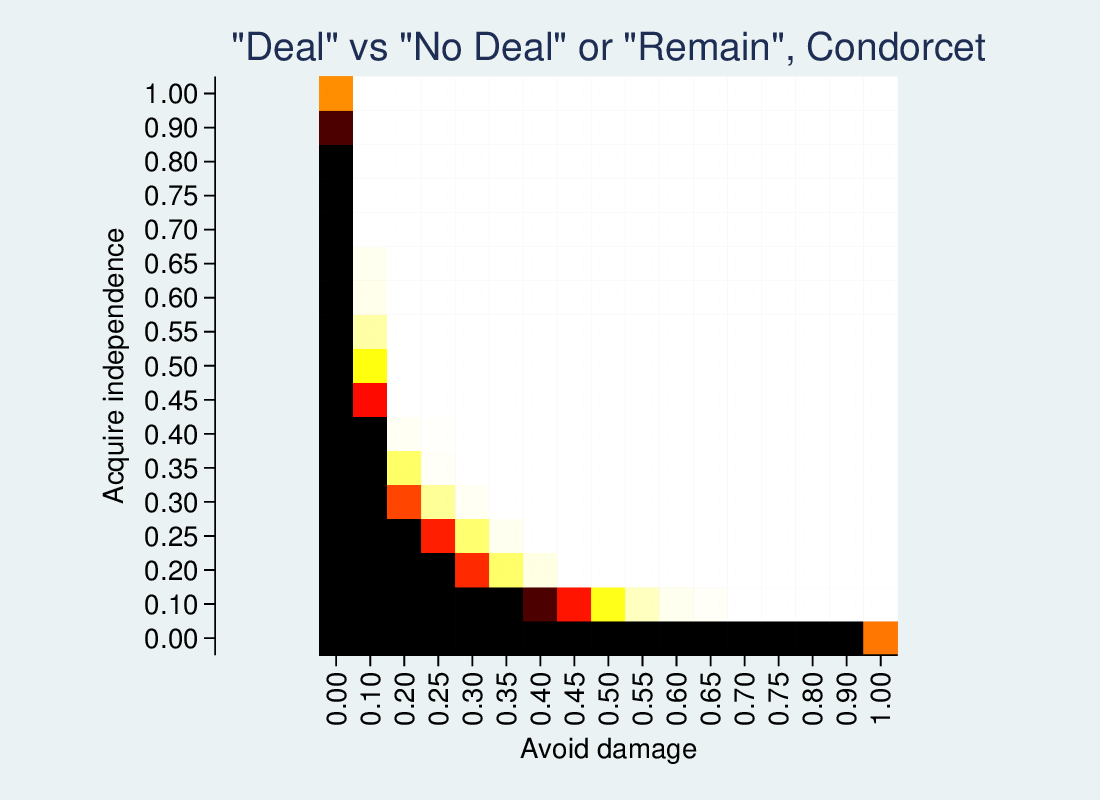
The general pattern is the same, but Condorcet is much more likely to go with the compromise deal than IRV.
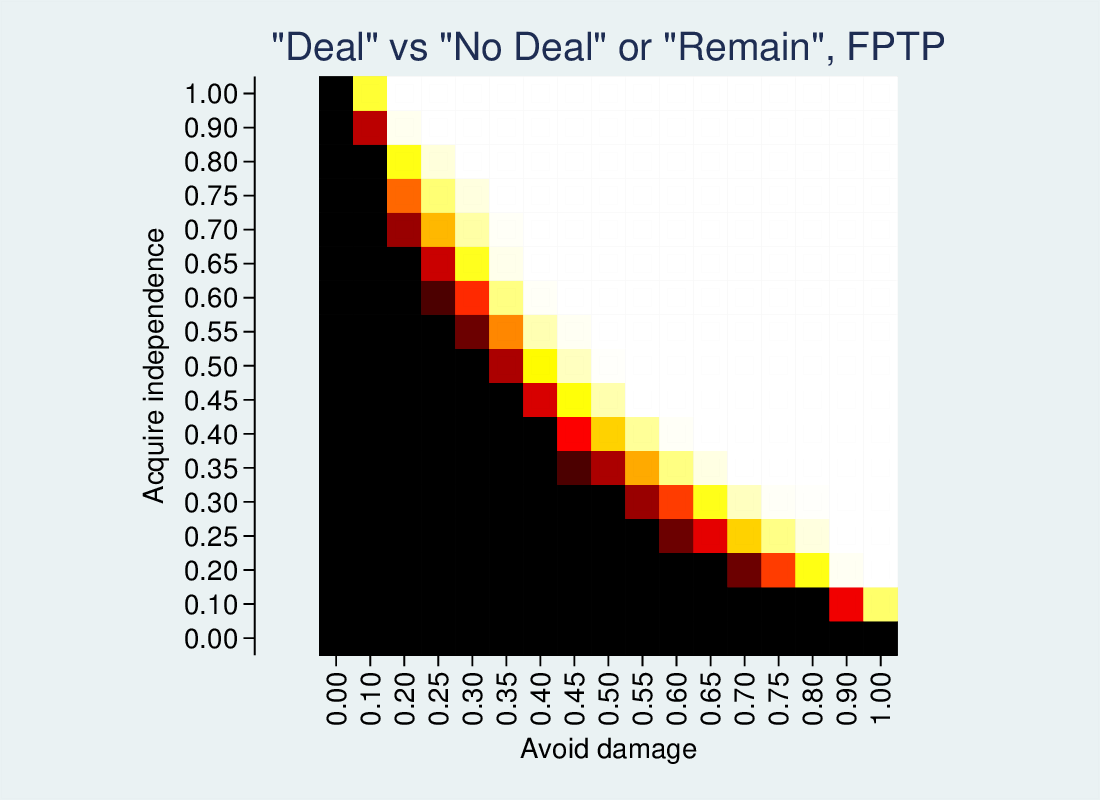
FPTP is pretty extreme, and is least likely to pick the deal.
Skewing the population
If the average preferences in the population are not balanced, and are more pro-independence, or more anti-damage, the outcome will be different. In particular, either no-deal or remain will become rather more popular. Indeed, after a certain amount of skew one of those options will never win. The following graphic looks at this for a pro-leave skew, zero skew (i.e., exactly like the foregoing graphs) and a pro-remain skew. The graph has a three-way colour scheme: bright green for 100% deal wins, bright red for 100% no-deal wins, and bright blue for 100% remain wins. Outcomes between these three have blended colours.
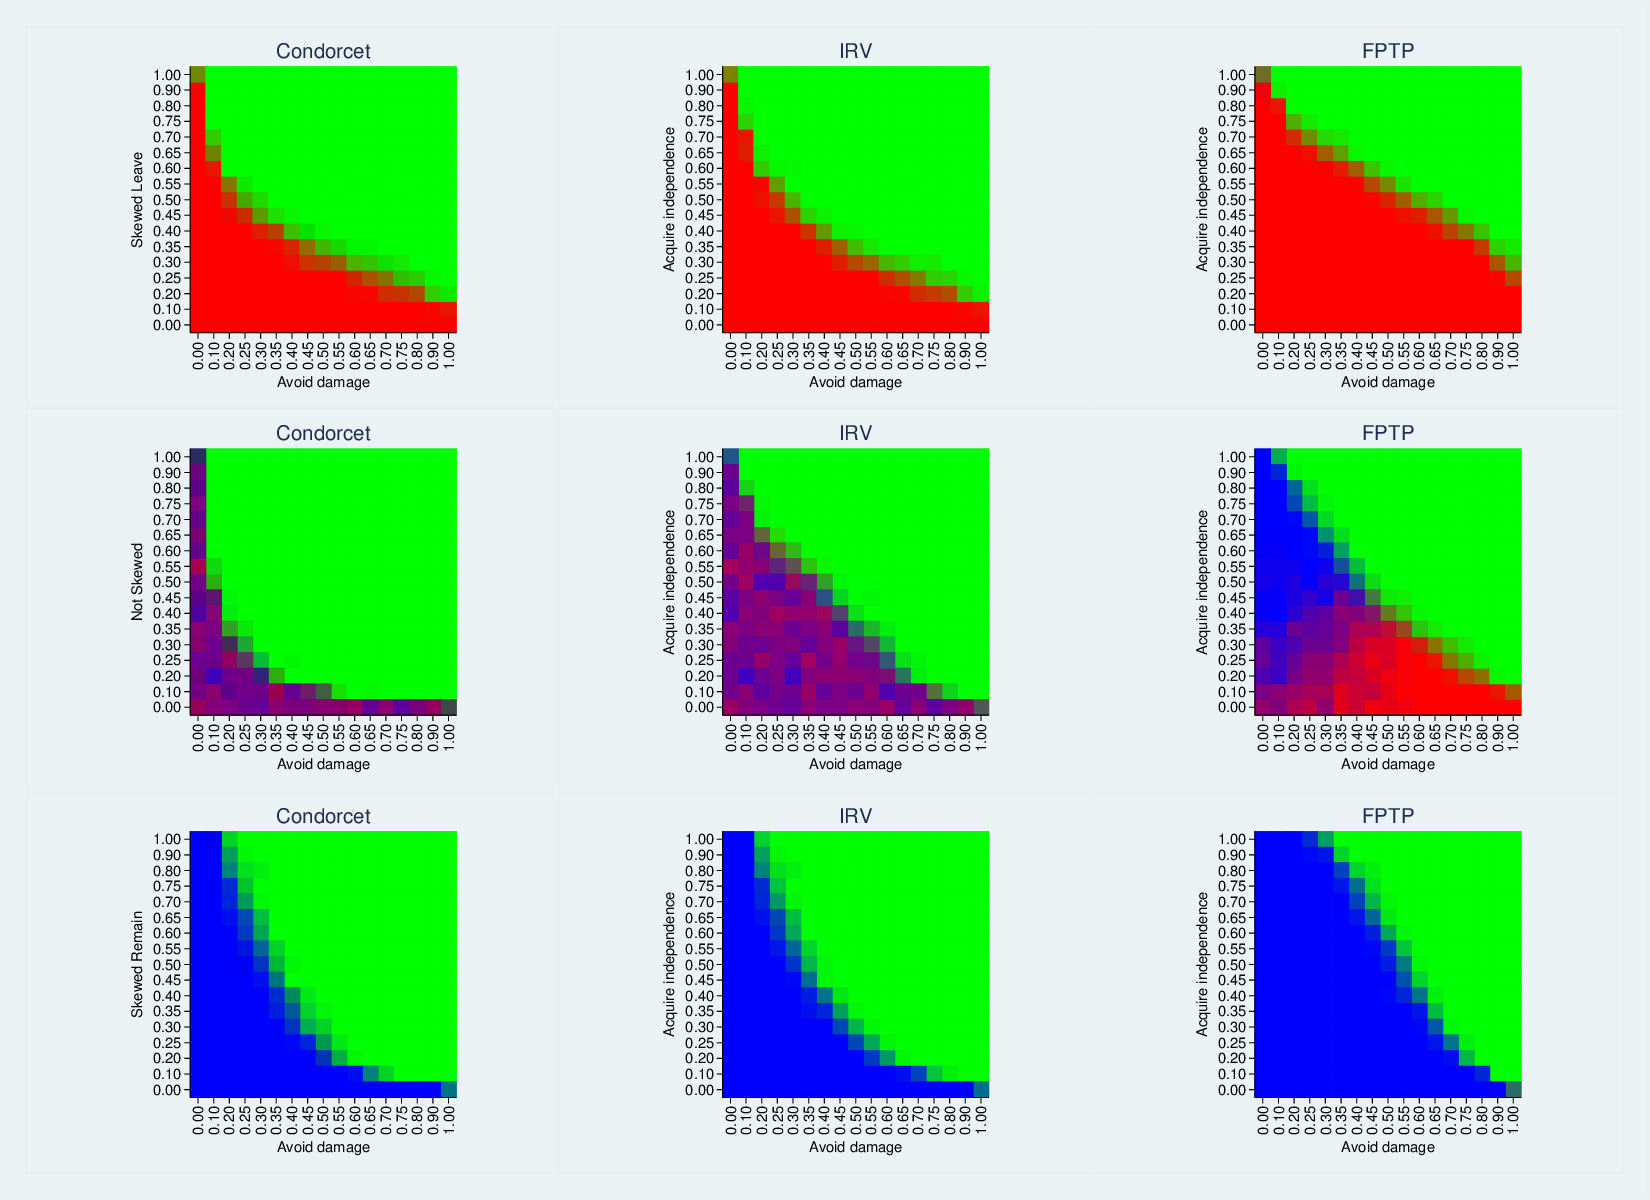
In the first row, we have a pro-leave skew. Remain doesn’t get a look in, IRV and Condorcet give more similar results, and both go for the deal rather more often than FPTP, which only goes for implausibly good deals. IRV and Condorcet are more similar to each other because with skew it is more of a two horse race, and the category eliminated under IRV will be very weak under Condorcet too.
In the third row, the skew is pro-remain and the picture is a mirror image of the pro-leave skew.
The middle row corresponds to the graphs shown above, for no skew, but through light on the three choices. For Condorcet and IRV, if the deal isn’t good enough to win, the result is a purplish mess of no-deal and remain. FPTP doesn’t manage so well though: when the deal is good from a remain point of view, no-deal is likely to win, and when it is good from a leave point of view, remain is likely to win. In other words, a deal that is good for one side will split that side’s vote.
Comparing results
Some tabular comparisons:
---------------------------------------------------------------
    |    Pro-Leave            Balanced            Pro-remain
    |------ Cond------ -------- Cond ----- -------- Cond -----
IRV |  0    1    2    3    0    1    2    3    0    1    2    3
----+----------------------------------------------------------
  1 | 10 3575  151        20  845  988
  2 | 23      6356         3    4 6233    3           6349    2
  3 |                     83      1022  914   36       165 3563
---------------------------------------------------------------
We see that Condorcet is more likely to go for the deal in all circumstances than IRV, but much more when there is balance.
Condorcet by Skew
        | Pro-leave   Balanced Pro-remain |     Total
--------+---------------------------------+----------
      0 |      0.33       1.05       0.36 |      0.58
      1 |     35.34       8.39       0.00 |     14.58
      2 |     64.33      81.49      64.40 |     70.07
      3 |      0.00       9.07      35.24 |     14.77
--------+---------------------------------+----------
  Total |    100.00     100.00     100.00 |    100.00
We also see that there are relatively few 0s, Condorcet cycles, and these are more common where preferences are balanced. Separate analysis (not shown) finds that increasing the size of the simulated electorate (these examples use 1,000) reduces the proportion of cycles to near zero.
Looking at IRV vs FPTP, we see that IRV is much more likely to go for the deal. In fact, if FPTP goes for the deal, both IRV and Condorcet will nearly always do so too.
-----------------------------------------------------------------
       |                      skew2 and fptp
       | ------- 1 ------    ------- 2 ------    ------- 3 ------
   irv |    1     2     3       1     2     3       1     2     3
-------+---------------------------------------------------------
     1 | 3731     2     3    1223         630
     2 | 1983  4392     4     417  5435   391       2  4392  1957
     3 |                      686        1333       5     3  3756
-----------------------------------------------------------------
Utilities
The point of a referendum is to gauge opinion. If opinions are based on utilities, on preferences, a good electoral scheme should yield outcomes that correspond to these preferences. While the utilities underlying preferences are by definition unobserved in the real world, in simulations we have access to them. If we were to calculate the mean utility of each outcome across the population, and choose the outcome with the highest mean, it would appear to be a gold-standard. However, this is not really the case, not least because the utilities can be transformed in scale without changing individual preferences, but this can change the over-all means. Nonetheless, for the sake of the exercise, if we compare an outcome based on highest mean utility with FPTP, IRV and Condorcet we get the following:
. tab fptp uvote

           |              uvote
      fptp |         1          2          3 |     Total
-----------+---------------------------------+----------
         1 |     1,661      4,086        978 |     6,725
         2 |         0     15,519          0 |    15,519
         3 |       946      3,980      1,730 |     6,656
-----------+---------------------------------+----------
     Total |     2,607     23,585      2,708 |    28,900


. tab irv uvote

           |              uvote
       irv |         1          2          3 |     Total
-----------+---------------------------------+----------
         1 |     1,923      2,803        634 |     5,360
         2 |        18     17,831         11 |    17,860
         3 |       666      2,951      2,063 |     5,680
-----------+---------------------------------+----------
     Total |     2,607     23,585      2,708 |    28,900


. tab cond uvote

           |              uvote
      cond |         1          2          3 |     Total
-----------+---------------------------------+----------
         0 |       118         52        101 |       271
         1 |     1,865         72        602 |     2,539
         2 |        67     23,375         76 |    23,518
         3 |       557         86      1,929 |     2,572
-----------+---------------------------------+----------
     Total |     2,607     23,585      2,708 |    28,900
In summary, Condorcet agrees with the utility-based outcome 94% of the time, IRV 75% and FPTP only 65%.
Conclusions
This is a very abstract analysis, and can’t speak to Brexit in any sort of predictive sense. In particular, the terrain is likely to be more complicated than two dimensions, and my model of voter preferences is not informed by data. Similarly, what the ultimate deal would look like may not well be captured by the two dimensions.
One thing the graphs might suggest is that a deal would be popular, with large areas in the top and right where the deal option wins. In reality that’s false, as any deals negotiated are likely to be well in the lower left of the graphic, low on independence and still involving substantial damage to the UK.
However, the analysis does say something about the mechanics of the three counting principles:
- Condorcet is much more likely to go for the compromise solution (the deal), particularly if the electorate is finely balanced, and FPTP the least.
- Condorcet seems to correspond well with the average of the underlying utilities.
- When the population is skewed pro-leave or pro-remain IRV and Condorcet give more similar results (because it becomes more of a two-horse race).
- Condorcet cycles are rare.
- FPTP is crap because votes can be split.