A very nice idea: search for evidence of COVID-19 RNA in municipal wastewater, as a cheap and fast form of public health surveillance. A pre-print shows that this works well, in a trial in Connecticut. I think the evidence is in their favour, but they commit two cardinal errors: first, they report a correlation (well, a squared correlation) between time-series and second, they do it on smoothed data. Autocorrelation means time-series may have vastly inflated and/or spurious correlations, and stripping the noise out of variables removes the noise from the comparison, making it seem, well, much less noisy than it is.
This is one of their key results: the smoothed RNA curve looks just like the smoothed hospital admissions curve, with a lead of about 3 days:
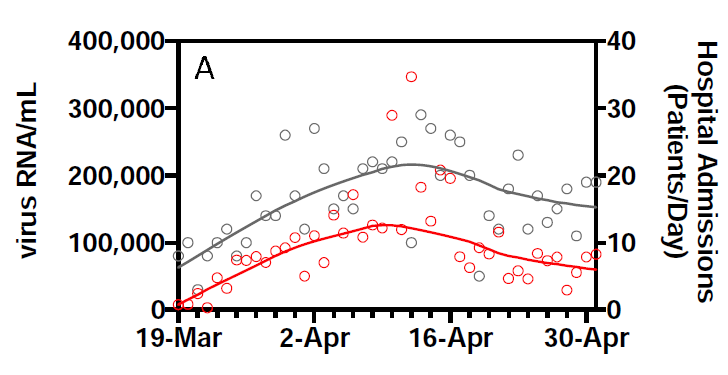
They report an R2 of 0.99 for this relationship.
However, they also show the data. Given there are 2 series for 44 days, we can pick this off the graph without too much effort:
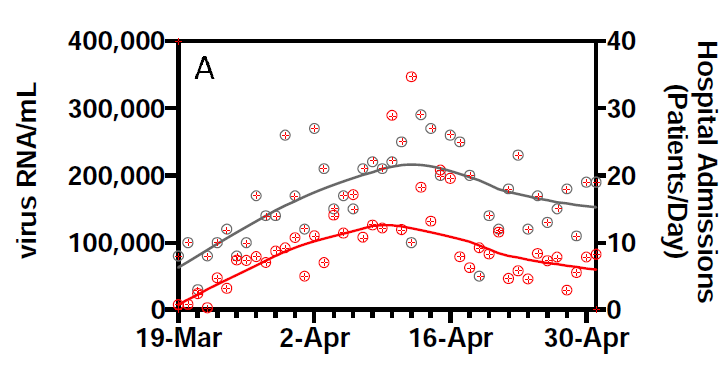
(This is prompted by @lycraolaoghaire’s tweets: https://twitter.com/lycraolaoghaire/status/1265251252239286272?s=20).
It turns out that the correlation between the RNA measurement and hospital admissions is 0.357 (R2 = 0.13). If we lag by one day, the R2 rises to a very respectable 0.45, but declines again if we lag by 2 (0.22) or 3 (0.22) days. In other words, there is a real signal here, but it is vastly overstated by R2 = 0.99, and the lead it gives is not as big as claimed.
Predicting hospital admissions using lagged RNA values, with lags of 1 to 5, and then all five lags together (green line) looks like this:
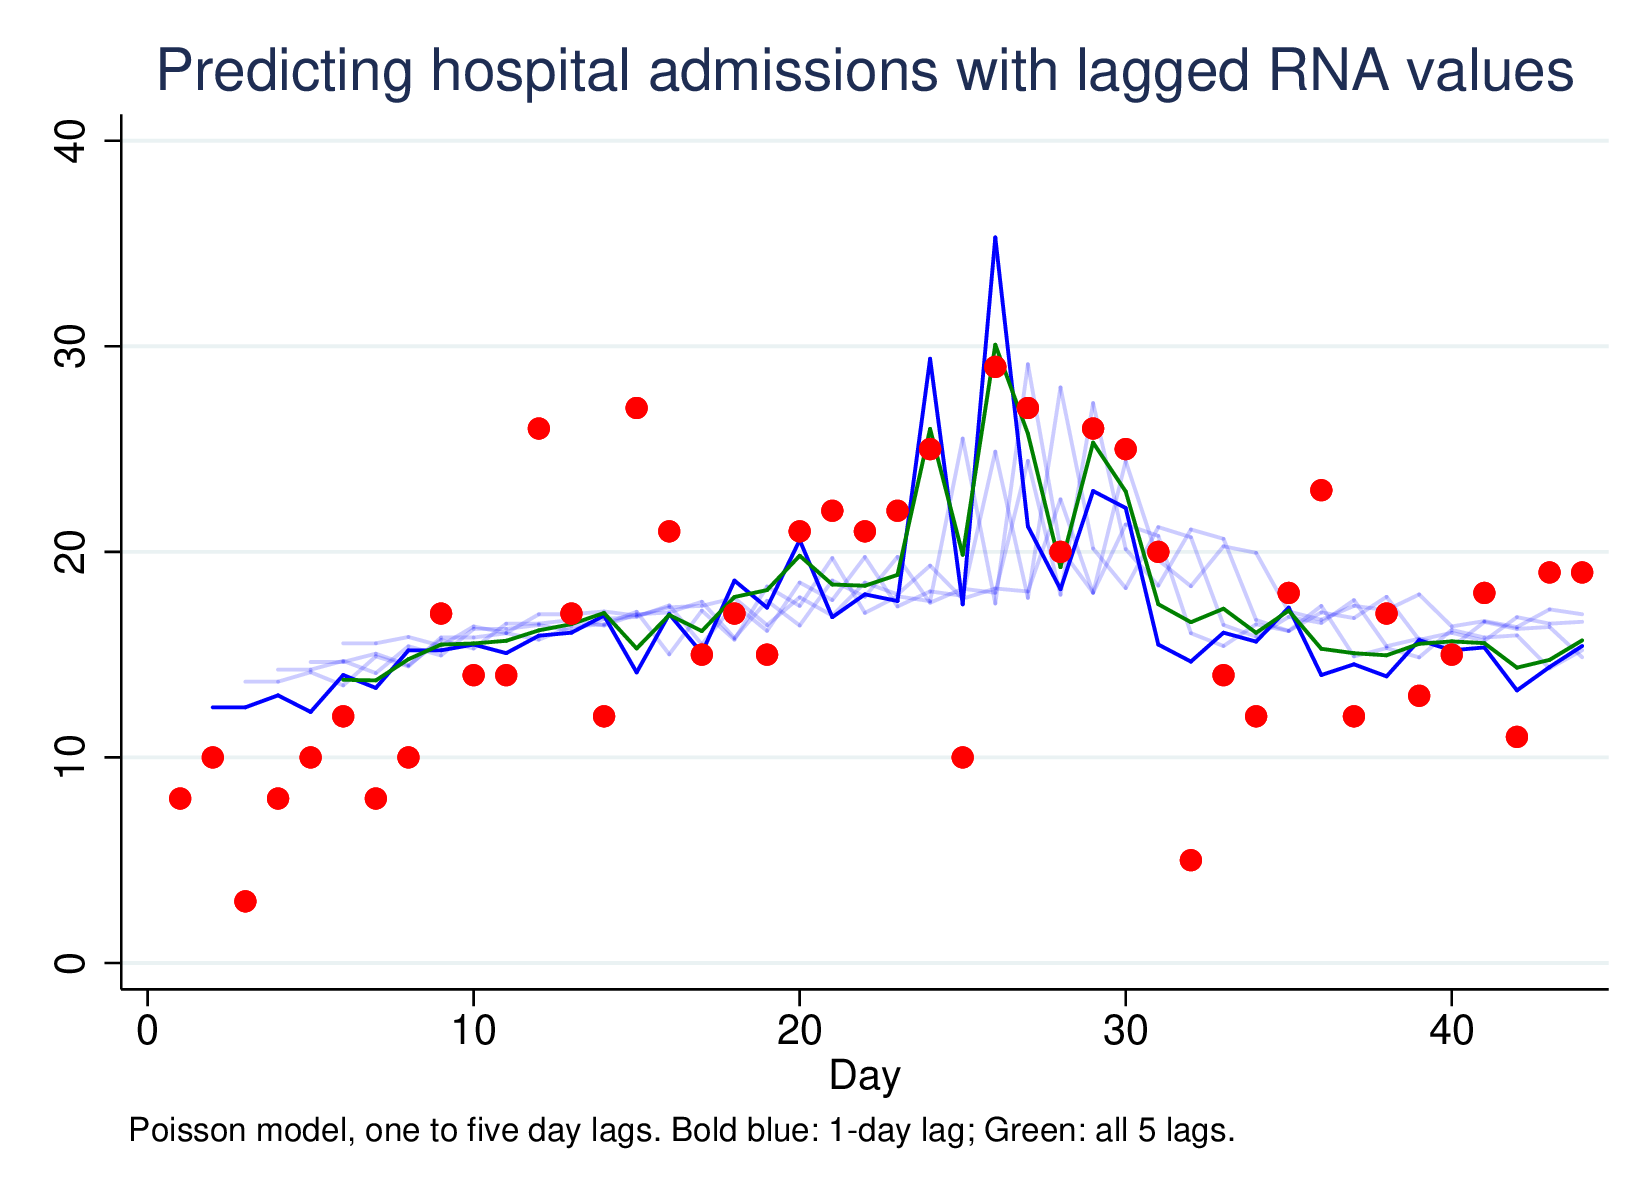
This is a much less impressive graph than the original, but it is picking up something. Most of the work is done by the one-day lag, which has a clear effect, and the combined 5-lag model isn’t better (by LR-test) than the L1 model only. However, using this technique very widely as a passive surveillance technique is going to pick up unexpected large shifts in disease RNA, which is much more important than being able to predict moderate changes in hospitalisation from moderate changes in RNA presence in sewage sludge.
Screen-picked data available here, no warranties.
I read your post, do not understand all of it.
I am control-engineer, I achieve accurate speed-control of noisy-feedback, high-inertia mechanical systems.
The hospital-deaths data has a huge weekend noise-blip, so I apply a 7-day rolling average filter. This transforms the data at the expense of a 3.5 day average lag.
For me it is crazy to use raw-data without this filter, the process-lag is more than 2-weeks and the consistent week-cycle coloration is huge.
So I would 7-day rolling-average deaths and sewage data and look at the curves, which I think is roughly what original paper did.
I would then apply statistical tools to estimate lag and correlation.
To use statistical tools to estimate lag and correlation without some sort of 7-day filter seems to me to be a big mistake !
Good point about the weekly pattern in admissions: it’s there and it matters. However, there are very few observations for smoothing (44 time-points: if it was audio it would be about 1/1000 of a second), many orders of magnitude less than I imagine you would have in an engineering application. I would be more inclined to take account of the cyclical pattern in the statistical analysis (e.g., using a term for day-of-week in the prediction model). If you do this the correlation between the predicted and observed values improves, implying an R2 between admissions and the 1-day lag of about 0.53 (up from 0.34). This is however a world away from the 0.994 reported.