Mike Tomlinson has created a certain amount of controversy by asserting that Northern Ireland’s COVID-19 death rate is disproportionate with that of the Republic (see article). In particular, he notes that the per capita rate of deaths in hospital settings (which is all that is reported for NI) is higher than that for the Republic (which normally reports all deaths, but for which the hospital deaths figure is also available). For instance, yesterday’s data says the cumulative figure for hospital deaths in the RoI is 386, while for NI it was 250.
Scaling by the relative populations, that suggests an expected NI hospital death rate of 386 * 1.891 / 4.904 = 148.8. 250 is a lot more than 149, even allowing for some incomparability in how the stats are collected.
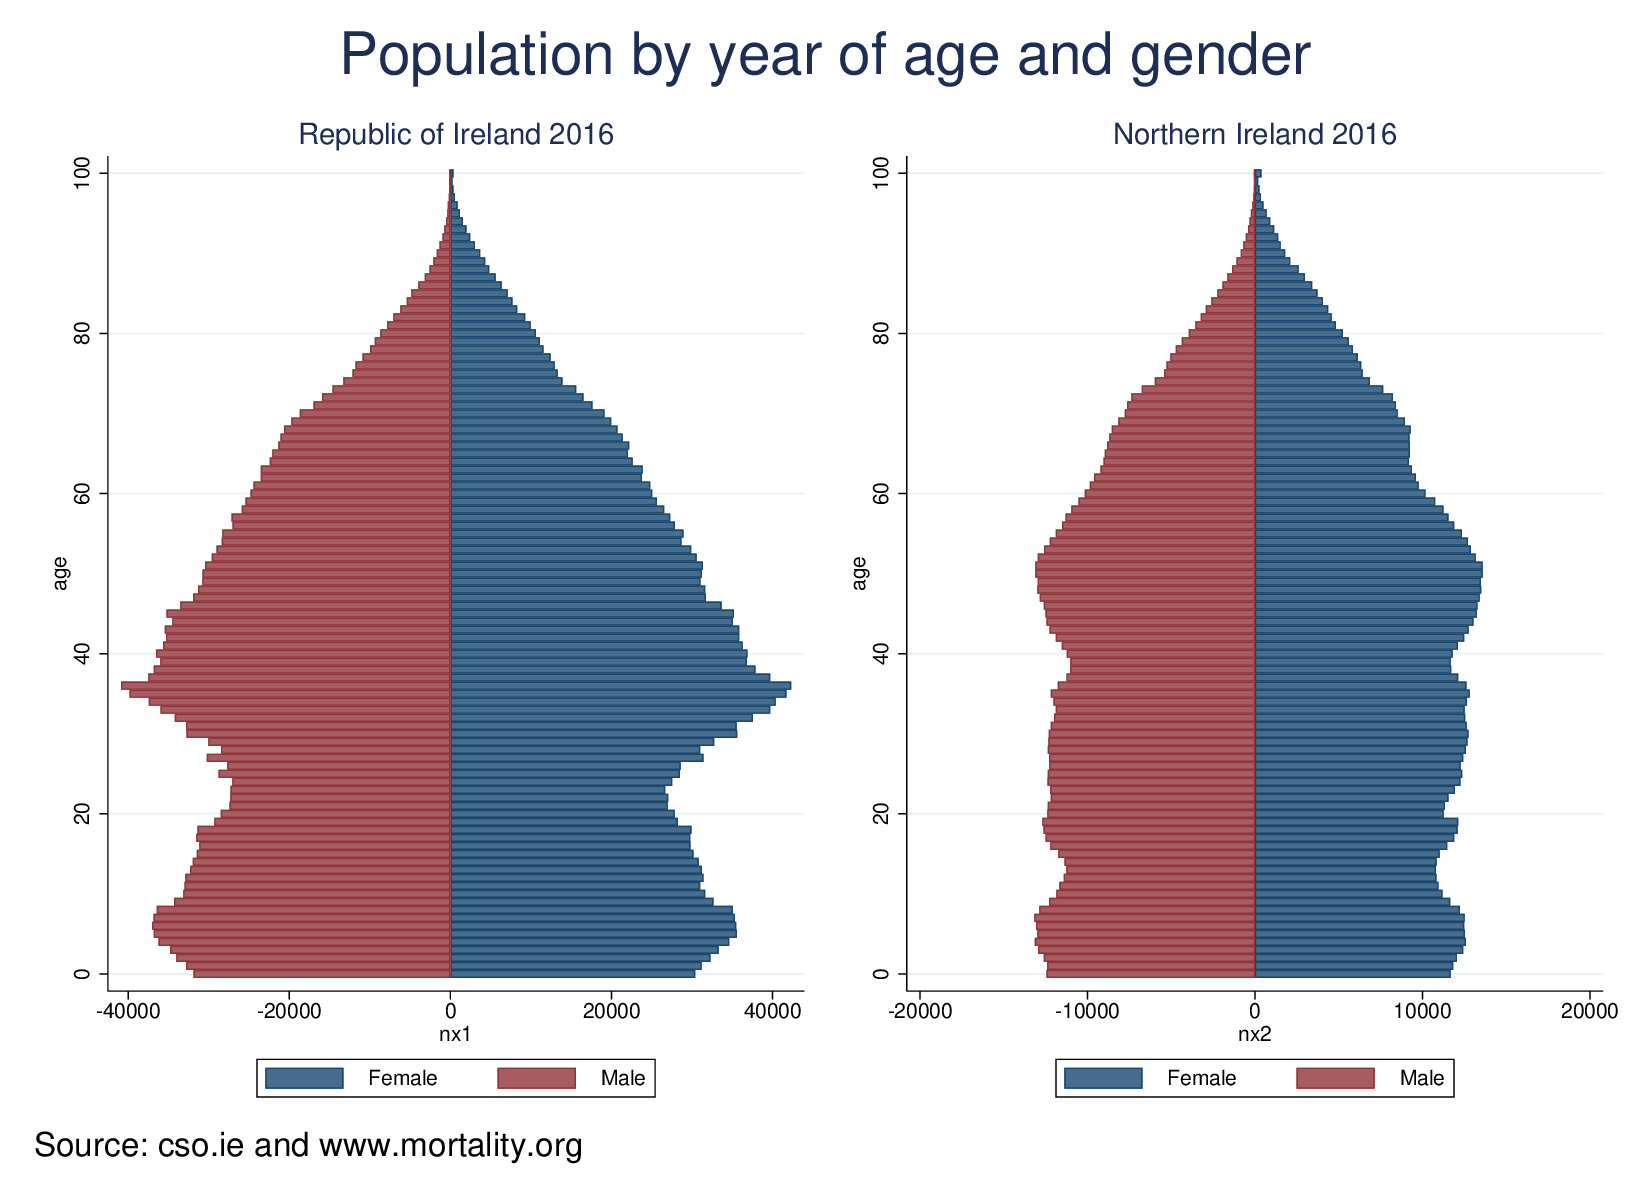
However, the NI population has a distinctly older profile than the RoI. Pulling year-of-age population data from the CSO for the RoI, and from the Human Mortality Database for NI, we can show this clearly:
This obviously matters for COVID-19 deaths, as mortality is very sharply age related. It may not yet be possible to get good data on the age pattern of mortality, but I have pulled the following table from WorldOmeter:
| Age range | Mortality rate |
|---|---|
| 80+ | 14.8 |
| 70-79 | 8.0 |
| 60-69 | 3.6 |
| 50-59 | 1.3 |
| 40-49 | 0.4 |
| 30-39 | 0.2 |
| 20-29 | 0.2 |
| 10-19 | 0.2 |
| 0- 9 | 0.0 |
In the absence of figures on age at decease of COVID-19 victims, and assuming that the rate of infection is independent of age (bit dodgy, there), we can calculate age-standardised expected deaths in NI (benchmarking on the RoI) as 173.48. That is, assuming the rate of infection is the same in the two zones (that NI has the RoI’s rate), and independent of age, NI should have about 174 hospital deaths.
In other words, taking account of the different age structure in this fashion reduces the differential but does not eliminate it. 149 < 174 < 250.
The assumption that infections affect all ages equally is likely false. From the gov.ie site, supplemented with population data (final column):
| Age | N | % cases | % pop (2016) |
|---|---|---|---|
| <1 | 28 | 0.2 | 1.31 |
| 1 – 4 | 58 | 0.4 | 5.65 |
| 5 – 14 | 169 | 1.1 | 14.18 |
| 15 – 24 | 1039 | 6.5 | 12.11 |
| 25 – 34 | 2635 | 16.6 | 13.85 |
| 35 – 44 | 2843 | 17.9 | 15.68 |
| 45 – 54 | 3039 | 19.1 | 13.15 |
| 55 – 64 | 2254 | 14.2 | 10.69 |
| 65+ | 3782 | 23.8 | 13.39 |
| Unknown | 24 | 0.2 |
Clearly, infection is also strongly increased with rising age, not just mortality. If we add this factor to the NI/RoI comparison, however, it has relatively little effect, as it’s mainly boosting a small category (the elderly) that is already boosted: it brings the expected NI rate to 178.
Conclusion: Some of Tomlinson’s NI/RoI difference is explained by the different age distributions, but not all. However, the data on which this is based (apart, at least, from the population estimates) is pretty shaky. Are esimates of hospital deaths comparable across the two jurisdictions? How will these estimates correspond to the accurate retrospective death figures we will have (from registration data) in a few months? How reliable, if at all, is the WorldOmeter estimate of the age pattern of mortality?
However, we can’t accuse Tomlinson of exaggeration on this basis.