People like the R2 stat from linear regression so much that they re-invent it in places it doesn’t naturally arise, such as logistic regression. The true R2 has nice clean interpretations, as the proportion of variation explained or the square of the correlation between observed and predicted values. The fake or pseudo-R2 statistics are often based on relating the loglikelihood of the current model against that of the null model (intercept only) in some way. There is a good overview at UCLA.
One of the most popular pseudo-R2 is McFadden’s. This is defined as 1 – LLm/LL0 where LLm is the log-likelihood of the current model, and LL0 that of the null model. This appears to have the range 0-1 though 1 will never be reached in practice.
It is well known that if we fit linear regressions by maximum-likelihood, we get exactly the same parameter estimates as if we fit by ordinary least squares. We can demonstrate this in Stata:
. sysuse auto

. reg price headroom mpg

. glm price headroom mpg
Since the ML estimation of the linear regression gives us loglikelihoods, we can calculate pseudo-R2 and true R2 for the same model. This code does it for a range of simple models with Stata’s demonstration “auto” data set:
sysuse auto, clear

glm price

local basell = e(ll)

local vars "mpg rep78 headroom trunk weight length turn displacement gear_ratio foreign"

local rhs = ""
gen r2 = .
gen mcf = .
local i 0
foreach var in `vars' {
local i = `i'+1
local rhs = "`rhs' `var'"
qui glm price `rhs'
local mcfad = 1 - (e(ll)/ `basell')
qui reg price `rhs'
di %6.3f `=e(r2)' %6.3f `mcfad' " : `rhs'"
qui replace r2 = `=e(r2)' in `i'
qui replace mcf = `mcfad' in `i'
}
label var mcf "McFadden Pseudo-R2"
label var r2 "R-squared"
scatter mcf r2
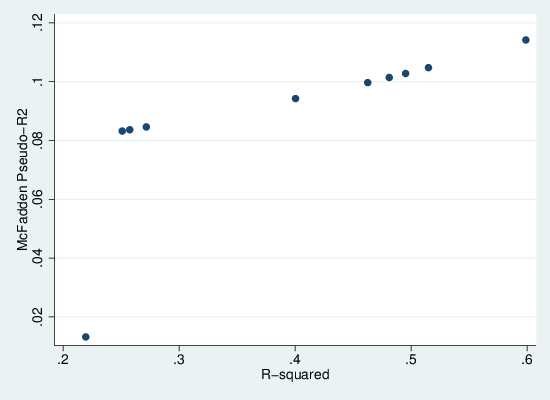
This generates the following graph, in which we see that there is a monotonic but non-linear relationship between the two measures. We can also see very clearly that pseudo-R2 is always substantially lower than R2. Thus it should be clear that while it emulates R2 in spirit, it doesn’t actually approximate it. So when people talk about proportion of variation explained in a logistic regression, shoot them down.
