All posts by brendan

Webscraping Wikipedia with Emacs

Idle hands

For the want of something better to do (okay, because procrastination), a pass at webscraping Wikipedia. For fun. I’m going to use it’s “Random Page” to sample pages, and then extract the edit history (looking at how often edited, and when). Let’s say we’re interested in getting an idea of the distribution of interest in editing pages.

See update: tidier code.

I’m going to use Emacs lisp for the web scraping.

OK, Wikipedia links to a random page from the Random Page link in the lefthand menu. This is a URL:

https://en.wikipedia.org/wiki/Special:Random

How random is this page? See https://en.wikipedia.org/wiki/Wikipedia:FAQ/Technical#random

Continue reading Webscraping Wikipedia with Emacs

Where did Brexit come from and why is it going nowhere?

That's unpossible
Ralph considers revoking A50
Britain is characterised by both a pragmatic able sensibleness, and inward-looking narcissistic post-imperial nostalgia. The latter finds the EU a symbolic humiliation, the former gets on with engaging with its benefits and influencing its development. However, because of the inward-looking nature of British/English exceptionalism, visibility of the advantages of the EU, and an understanding of it and its operations, are distinctly attenuated. Reap the benefit of the single market, but still think Johnny Foreigner is somehow less than the world-straddling Empire Brit.

This means there has long been a persistent pool of resentment about the EU, and a lack of understanding of its benefits.

Calamity strikes when idiot Cameron attempts to placate the monster with a referendum. Not only does the government get a well-deserved kicking for unrelated reasons, but the Remain camp is utterly unable (unwilling?) to communicate the real and symbolic advantages of the EU.
Continue reading Where did Brexit come from and why is it going nowhere?

Simple parallelism in Stata

Speeding up embarrassingly parallel work in Stata

Stata-MP enables parallel processing, but this really kicks in only in estimation commands that are programmed to exploit it. A lot of the time we may have very simply repetitive tasks for Stata to do, that could be packaged for parallel operation very easily. This sort of work is often called embarrassingly parallel, and isn’t automatically catered for by Stata-MP.

The simplest situation is where the same work needs to be done multiple times, with some different details each time but no dependence whatsoever on the other parts. For instance we may have a loop where the work in the body takes a long time but doesn’t depend on the results of the other runs.

I came across this situation the other day: I have data created by running a simulation with different values of two key parameters, and I wanted to create graphs for each combination of the parameters (PNGs rather than Stata graphs, but that’s just a detail). So I wrote code like the following:
Continue reading Simple parallelism in Stata

Triangular colour schemes for 2DF 3-way variables

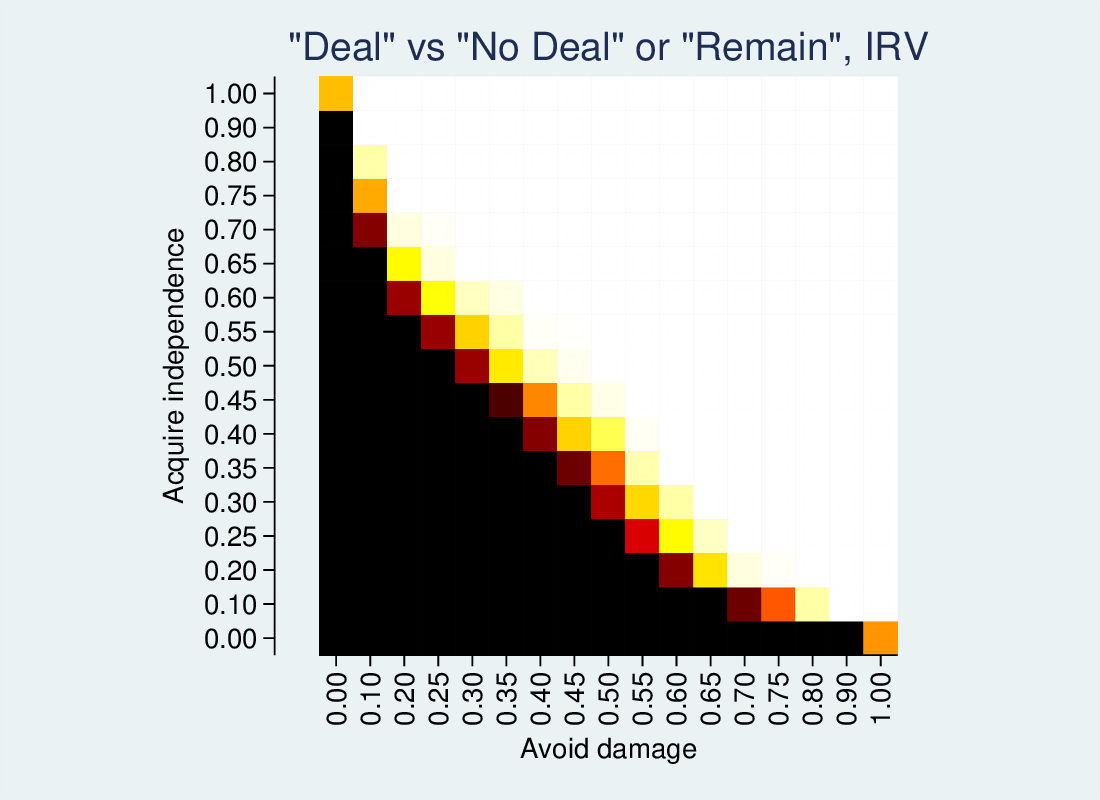
In my recent blog on three-way referendums, I found myself wanting to represent how a three-way outcome varied across two dimensions. It was easy enough to represent the prevalence of one of the outcomes versus the rest, on a scale of 0-100%, by sampling the two dimensions at discrete intervals, i.e., calculate the Z variable across an X-Y grid. This yields a one-dimensional heatmap, where colour codes the percentage of the outcome (black at 0% to white at 100%).

stv.png

Continue reading Triangular colour schemes for 2DF 3-way variables

Three-way referendums: Condorcet vs Instant Runoff

Simulating 3-way choice

I’ve been thinking about a potential second Brexit referendum, where a three-option menu is given:

  • 1: Exit the EU with no deal
  • 2: Accept the negotiated deal
  • 3: Remain in the EU

Three-way choices are alien to British experience of referendums, but don’t really pose great difficulties. First Past The Post (FPTP) is clearly undesirable, but instant runoff (IRV) and Condorcet voting are easy to implement and explain to the electorate. So I built a little simulation to help me understand the problem, particularly to look at the relative performance of IRV and Condorcet.

My conclusions in brief: Condorcet is much more likely to go for the compromise solution (the deal), IRV less so and FPTP the least. Condorcet also seems to correspond well with the average of the underlying utilities. When the population is skewed pro-leave or pro-remain, IRV and Condorcet give more similar results (because it becomes more of a two-horse race). Condorcet cycles are rare. Finally, FPTP is crap.

Continue reading Three-way referendums: Condorcet vs Instant Runoff

Doing away with Daylight Saving Time?

Doing away with DST

The European Commission has started making moves to suggest that countries should stop using daylight saving time, and decide on a year-wide timezone. There is a lot of support for this, particularly for a week or so in late October and late March every year.

Yes, the switches are inconvenient, particularly the spring one, where we lose rather than gain an hour’s sleep. But what are the advantages of DST? The gains that persist through the seasons stand out less than the transient annoyance of the switches. The key idea of DST is that in the summer, dawn is so early that we sleep through lots of daylight. Putting the clocks forward in the spring means one hour of this daylight is shifted to the evening. In Ireland this means we’re on GMT (a little ahead of solar time across the whole country, more so in the west) in the winter, and GMT+1 for the summer.

If DST is abolished, we remain on either GMT+0 or GMT+1 for the whole year. I suspect GMT+1 would be favoured, because it keeps us closer to the continent.

The Irish Department of Justice is seeking feedback on the issue until 30 November 2018. Direct feedback form link

Continue reading Doing away with Daylight Saving Time?

Generating transition-based substitution costs: SADI vs SQ

Sequence analysts often use substitution costs based on transition rates. While I believe that using transition rates to define substitution costs is not always a good strategy, it can be useful and is implemented in SADI (via the trans2subs command). It is also available in SQ (via the subs(meanprobdistance) option).

Continue reading Generating transition-based substitution costs: SADI vs SQ

Handling dyadic data in Stata

Processing dyads in Stata

Sometimes when you are working with nested data (such as household surveys, with data on all individuals in the household), analysis focuses on dyads (such as spouse pairs) rather than individual cases. This means you need to link data in one observation with that in another. As long as the data includes information in ego’s record about where alter’s record is (e.g., by holding alter’s ID as a variable), the simplest way to do this is to create a separate data file, where the alter ID variable is renamed to ID, and the substantive variables are also renamed, and to match it back in to the original data. This is not terribly difficult, but it is messy, so I present here a more convenient method.
Continue reading Handling dyadic data in Stata

Logistic Regression vs the Linear Probability Model

Logit vs LPM with differing ranges of observation of X

The linear probability model (LPM) is increasingly being recommended as a robust alternative to the shortcomings of logistic regression. (See Jake Westfall’s blog for a good summary of some of the arguments, from a pro-logistic point of view.) However, while the LPM may be more robust in some senses, it is well-known that it does not deal with the fact that probability is restricted to the 0–1 range. This is not just a technical problem: as a result its estimates will differ if the range of X differs, even when the underlying process generating the data is the same. For instance, if X makes the outcome more likely, and we observe a moderate range of X we will get a certain positive slope coefficient from the LPM. If we supplement the sample with observations from a higher range of X (sufficiently high that the observed proportion with the outcome is close to 100%), the slope coefficient will tend to be depressed, necessarily to accommodate the observations with the higher X but the at-most marginally higher proportion of the outcome. The same is not true of the logistic model.

(I have already blogged about inconsistencies in the LPM in the face of changes in the data generating process; here, I am talking about inconsistencies of the LPM where the observed range of X changes under an unchanging data generation model.)

In other words, if there are different sub-populations where the true relationship between X and the outcome is the same, but the range of X is different, the LPM will give less consistent results than the logistic regression model.
Continue reading Logistic Regression vs the Linear Probability Model

The triangle inequality

I have a Stata program, metricp, which takes a distance matrix (square, symmetric, zero diagonal) and tests for the triangle inequality (that for all i, j, there is no k such that d[i,j] > d[i,k] + d[j,k]).

I needed something similar today in R, and found Matthew Vavrek’s fossil package, which includes a tri.ineq() function. However, it turned out to be very slow on the large matrix I threw at it, so I decided to speed it up with some of the techniques in metricp.ado.

Continue reading The triangle inequality