Premise
Did Twitter lose activity since the ElMuskalypse? Is my timeline quieter than it used to be when I was reading it? I mothballed my account around the end of November, after Elon Musk took over. How much activity have I been missing? To what extent have the people I followed also stepped back from Twitter?
How would you measure activity of your Twitter (ex-)timeline? Using the Twitter API, how would you assess whether the people you follow are more or less active? The simplest idea is to download the tweeting history of everyone you followed, and tot up their tweets by day. In principle that’s easy to do, if you have access to the Twitter API (and it still works). But it turns out it’s a bit more complicated than that, if you want to use this data to characterise how your timeline would have behaved in the interim.
Spoiler: This posts investigates whether Twitter activity as viewed from my account has fallen. The answer to that seems to be “yes, but lots of my tweeps are still very active”. Twitter isn’t going to die just because people like me are ignoring it.
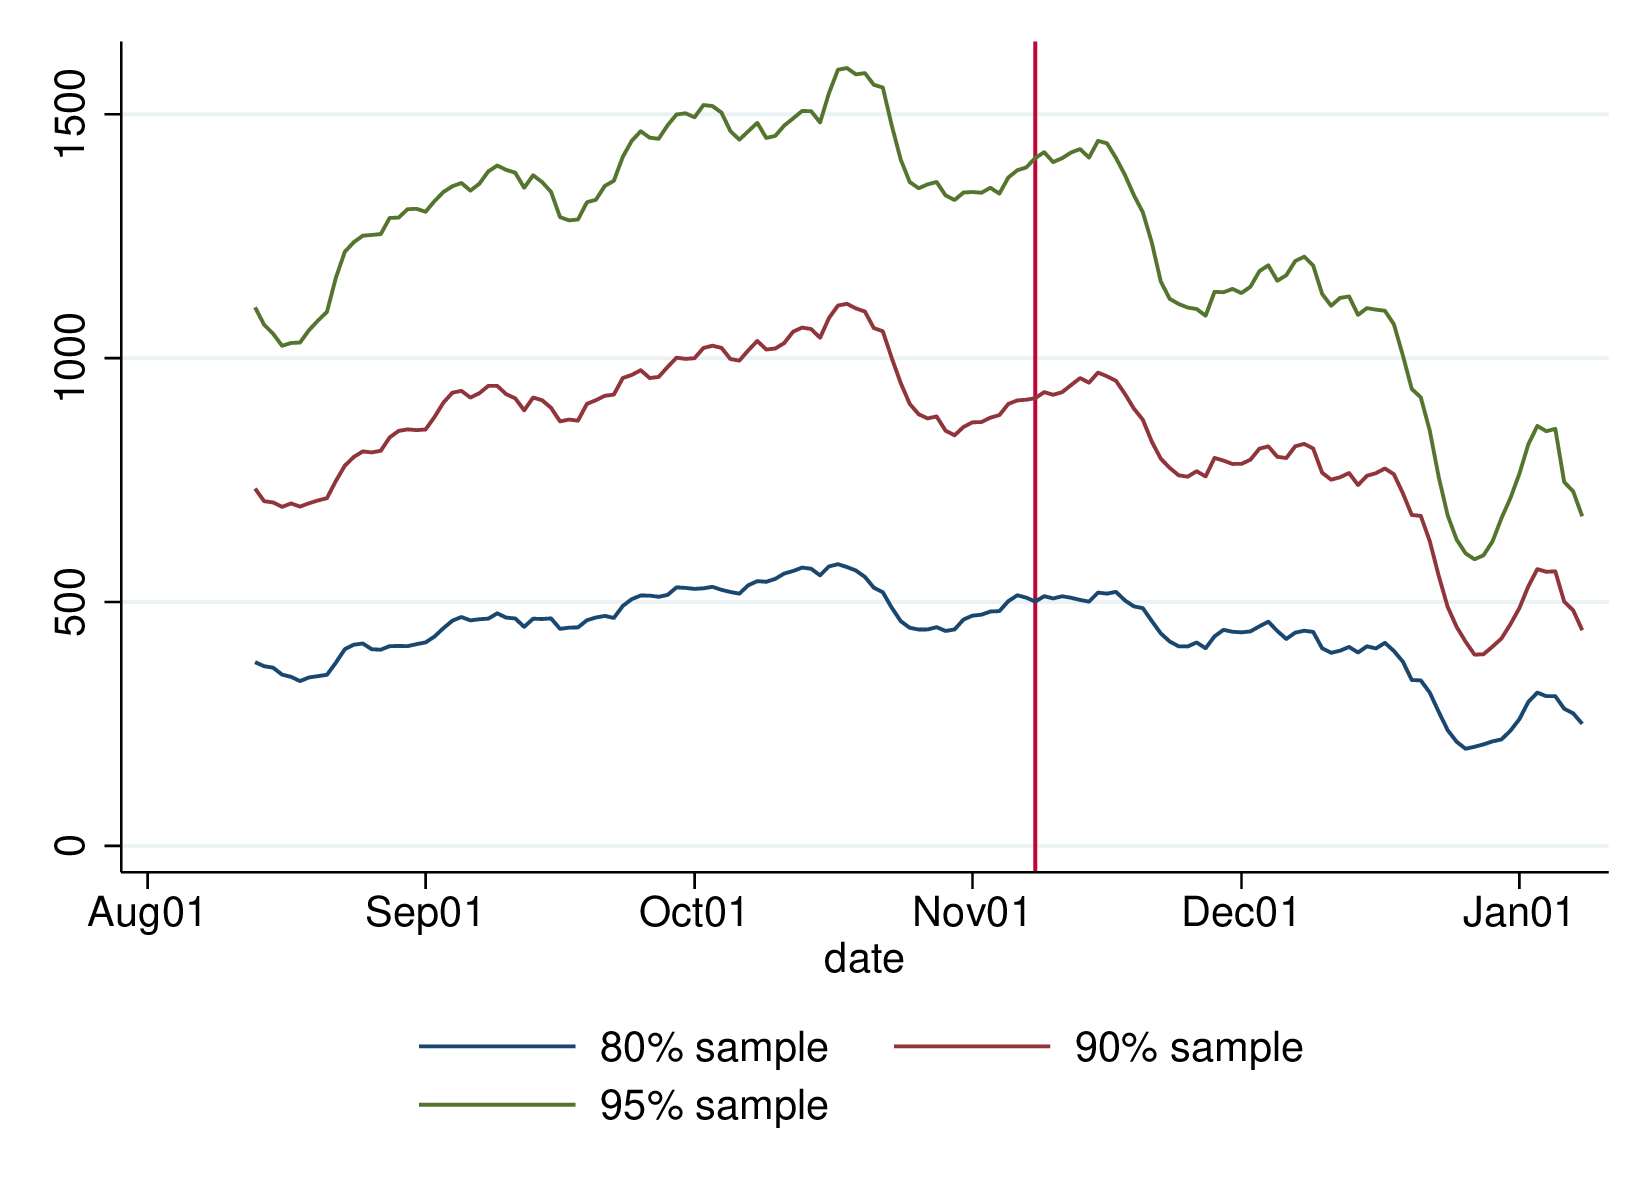
Figure 1: Line graph of twitter activity, explained below
Problems
There are at least two significant problems with this approach: 1: To the extent that there is a decline in activity, it may take the form of people deleting or protecting their accounts, rather than by reducing their frequency of posting 2: The API limits you to the most recent 3,200 tweets per account; this covers a short period for some people and a long period for others, so the retrospective period for which there is full coverage is quite short
Problem 1 is plausible, but of the 585 accounts I was following in Noverber 2022, I get full data on 580. Mostly, this is because I authenticated to the API with my own details, so I can see the tweets of protected accounts I followed (about 17; tweets from protected accounts are only visible to their followers). Only 5 accounts have disappeared: they may have been prolific tweeters or not, & may have left Twitter for Elonophobia or entirely unrelated reasons.
Problem 2 (more prolific tweeters’ histories necessarily cover only the more recent period) is, however, a bit of a doozy. One followee may have tweeted under 3000 times since 2006, but another has tweeted 3200 times since three weeks ago. (A small number of tweeters systematically delete their older tweets, so some people never build up a record of 3,200.) This means the distribution of observed tweets is strongly biased to the near past, suggesting exponential growth.
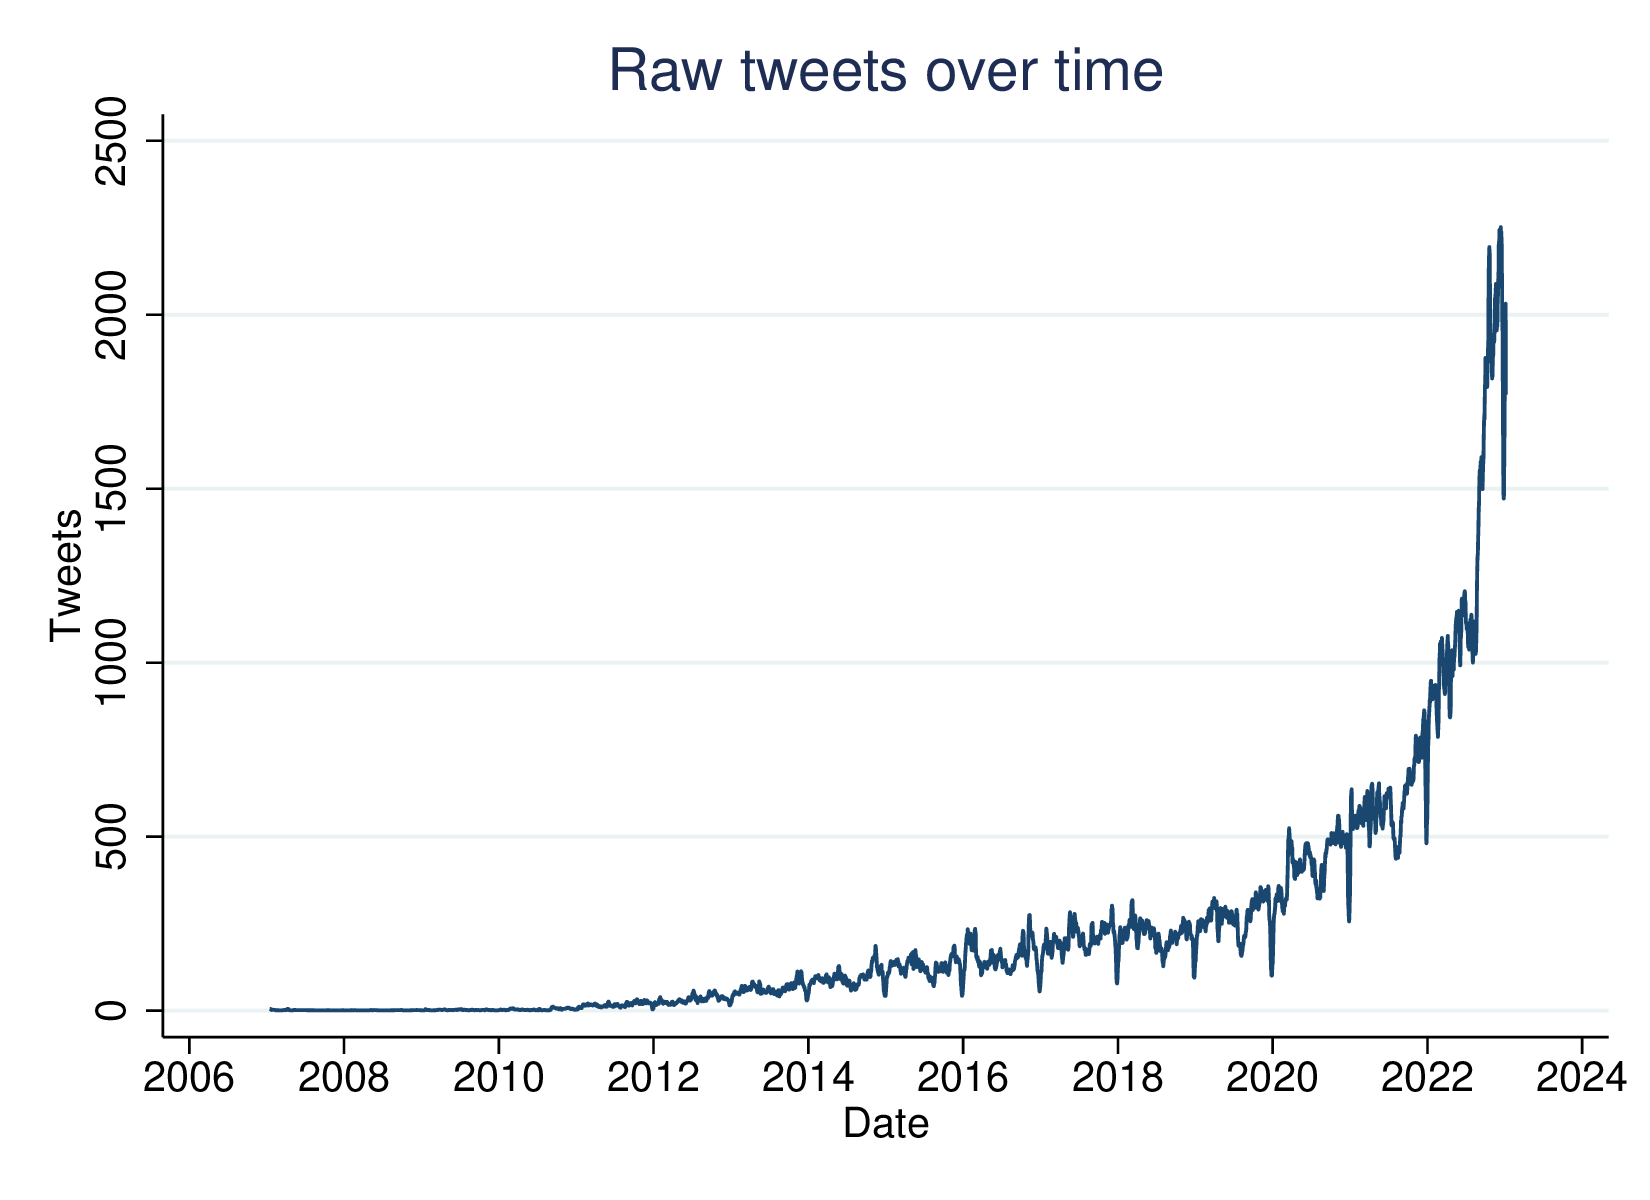
Figure 2: Raw twitter activity
Sampling
The problem is one of representing a time-span (November last until now, but with enough prior context to assess whether there has been a real change) with data collected retrospectively at a single point in time. While I can get almost-100% representation of the accounts I followed at that point (20/11/2022), it doesn’t represent the past adequately, since the API’s limit on tweets per account means more prolific tweeters are left-truncated more recently.
This is a problem I have often encountered before, notably working with retrospective work lifehistories in the British Household Panel Study.
The following graphic shows the extent of the coverage: each horizontal line joins an account’s earliest and most recent tweet in the database. Most of the lines represent almost 3,200 tweets, though some account have tweeted less.
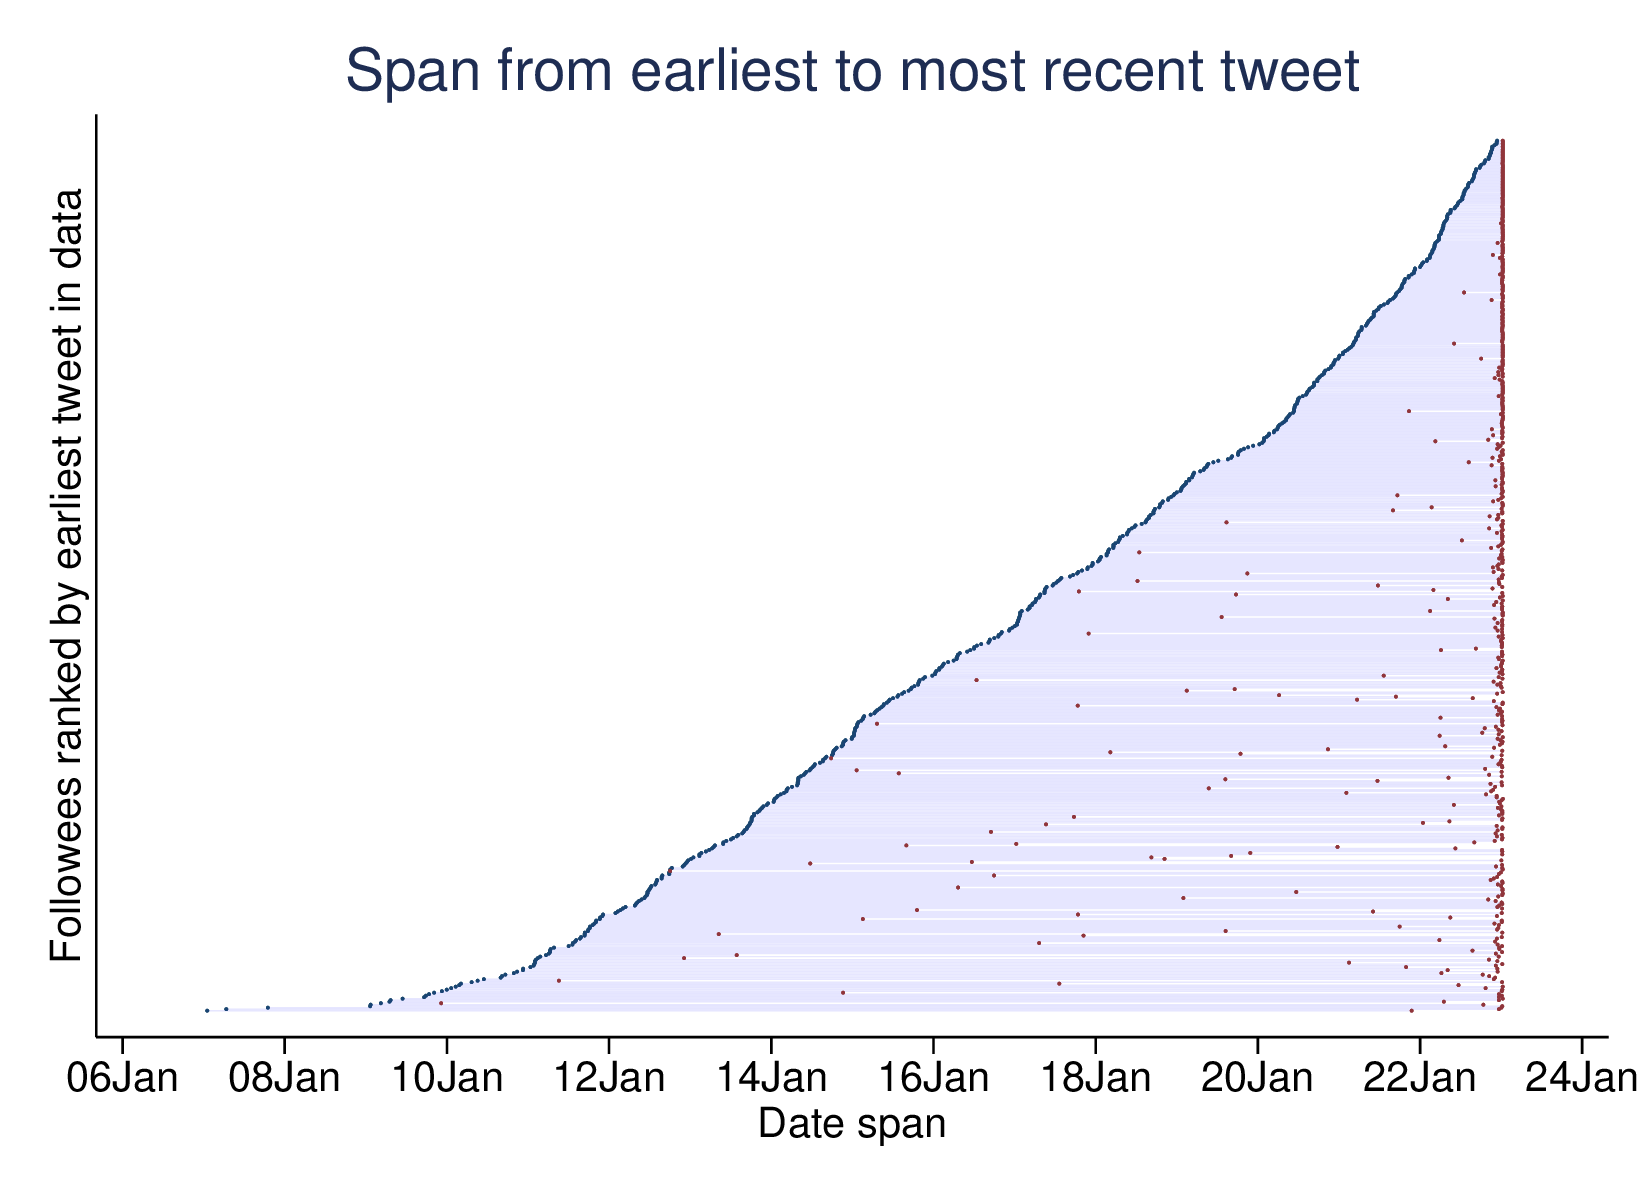
Figure 3: Time-span covered by each tweeter’s record. Earliest starts around Jan 2007, most recent in the last few weeks.
A first thought was to normalise the numbers day-by-day in terms of tweets per account observed rather than total tweets. That doesn’t work either, since we start by removing tweeters with the highest levels of tweets/day as we move back in time. We still end up with a sharp rise in estimated recent activity (and wild fluctuations in the early days, due to small denominators).
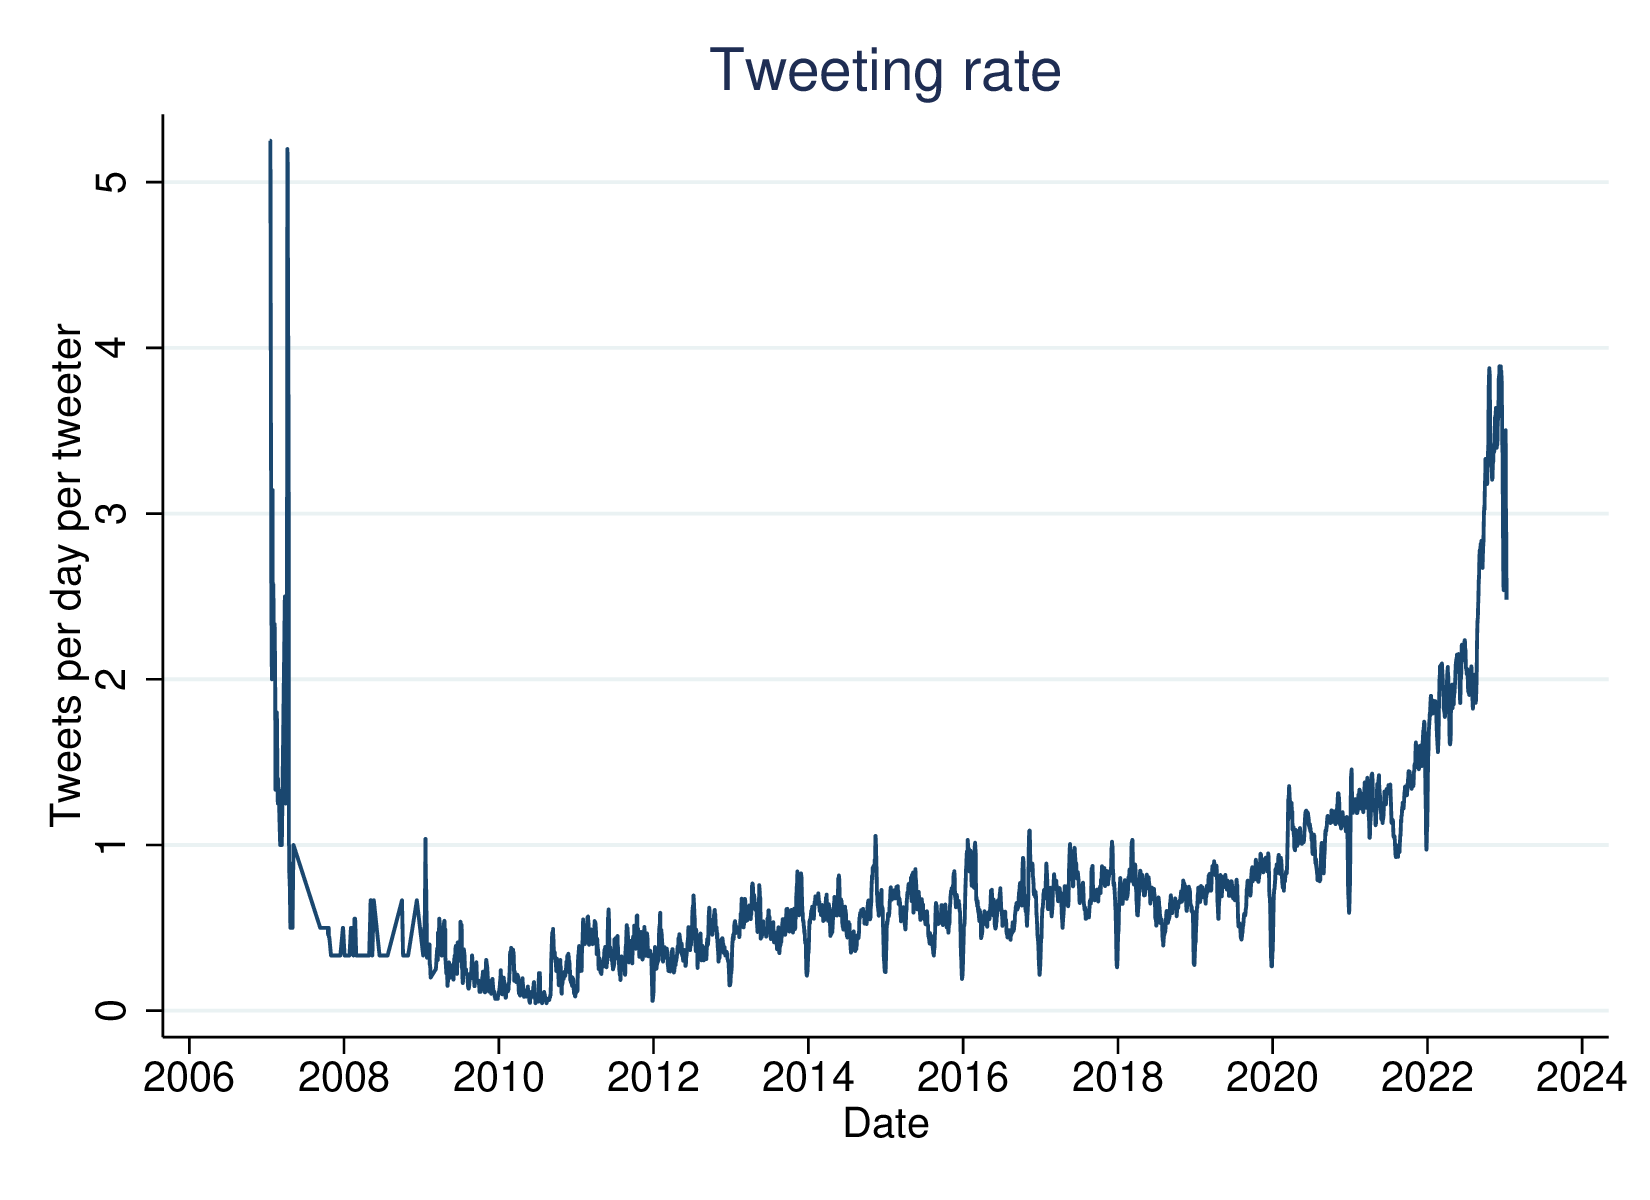
Figure 4: Tweets per day per observed account
Compromise
A rough compromise is to take a point back in time when we observe at least, say, 90% of accounts, and just look at those 90% over that period. There are two downsides: it discards the most prolific accounts, and it truncates how far back we can look, but it gives a consistent series. 90% of my followees have their earliest tweet in the data on 13 April or earlier. Only the most prolific 10% have tweeted more than 3200 times beginning more recently than that. The following graph shows their activity.
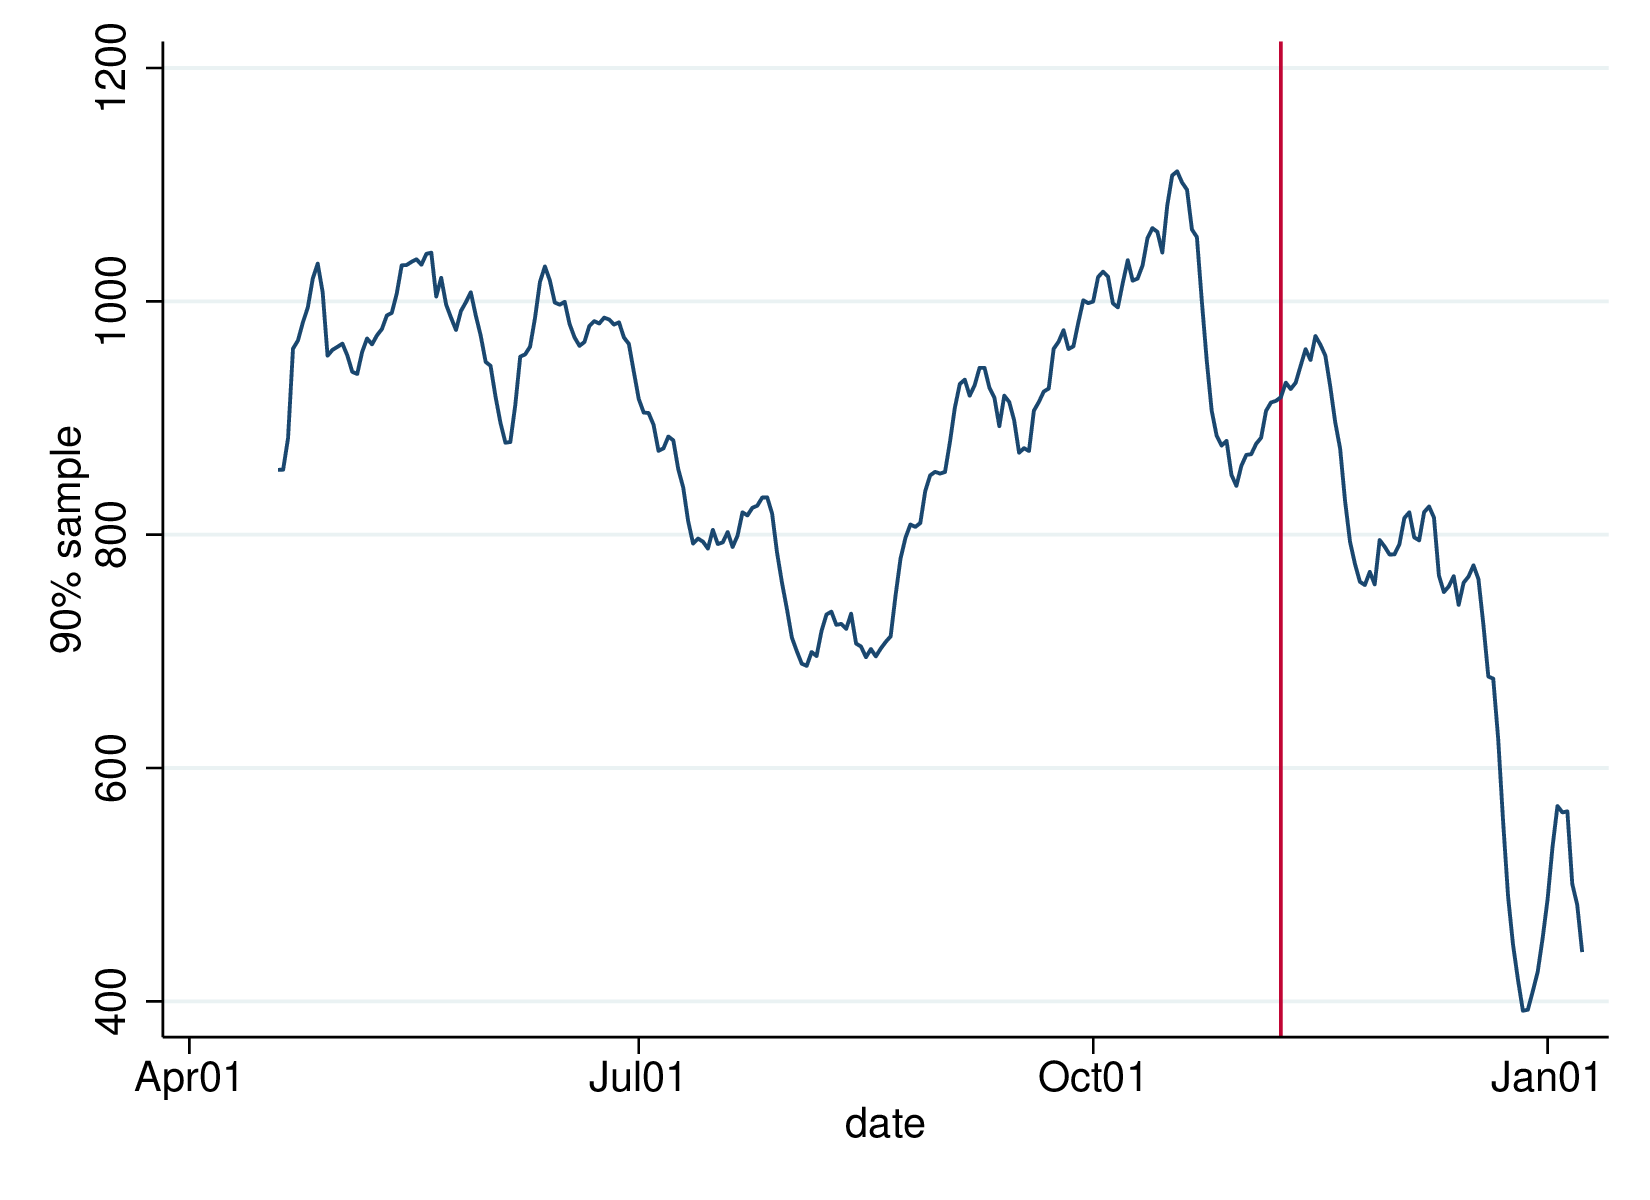
Figure 5: Tweets since 13 April for accounts observed on or before that date
As can be seen, there is a good deal of variation, and a good deal of drop after Nov 8. However, for more context let’s look at the 80% sample (going back to 6 June 2021) and the 95% sample (only available from 6 August 2022, but containing all but the most prolific 5%). Both views largely agree with the 90% sample, but the 80% one goes back long enough to show something important: a large part of the dip in the 90% graph is due to the Christmas lull, also very sharp in 2021.
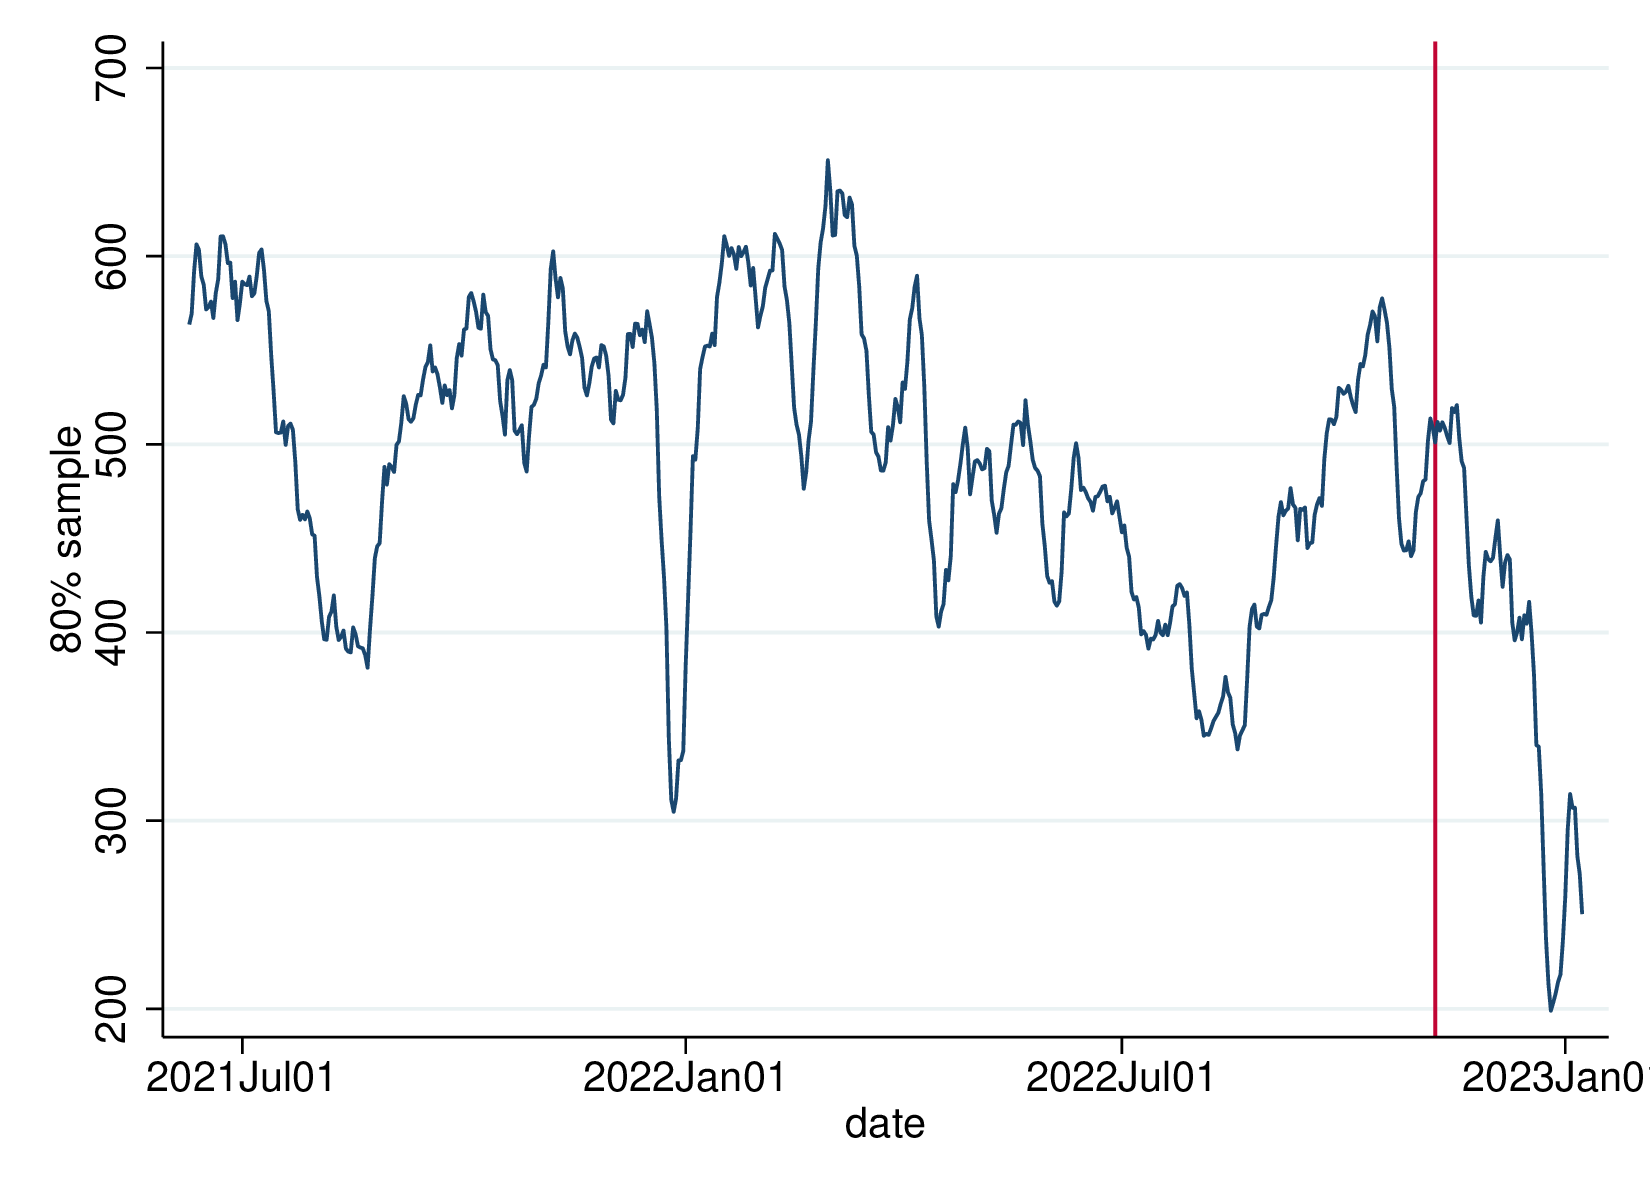
Figure 6: 80% sample twitter activity
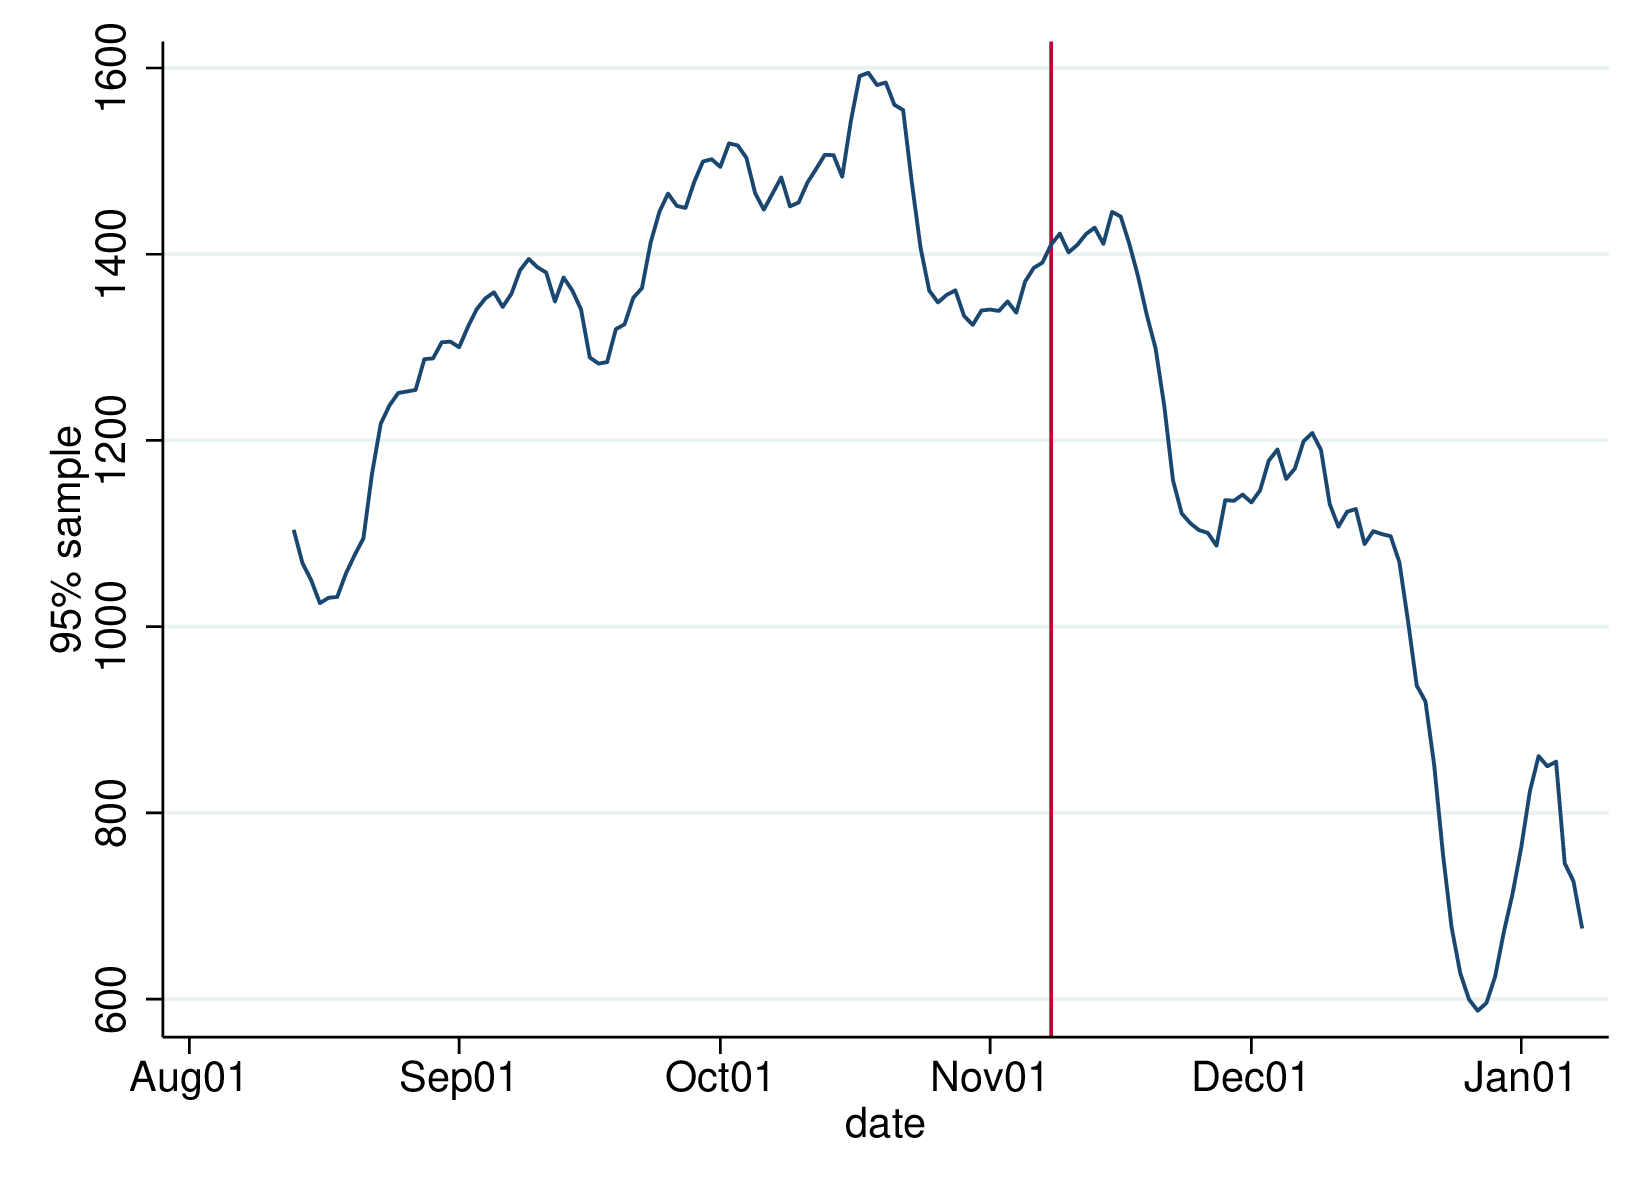
Figure 7: 95% sample twitter activity
The longer time span of the 80% sample shows us that slumps in late summer and Christmas happened in both 2021 and 2022. Thus a big part of the slump we see in the 90% line – but not all – is a Christmas effect. The shorter 95% span has lots more tweets in it, so it represents more activity.
The three series can usefully be viewed together:
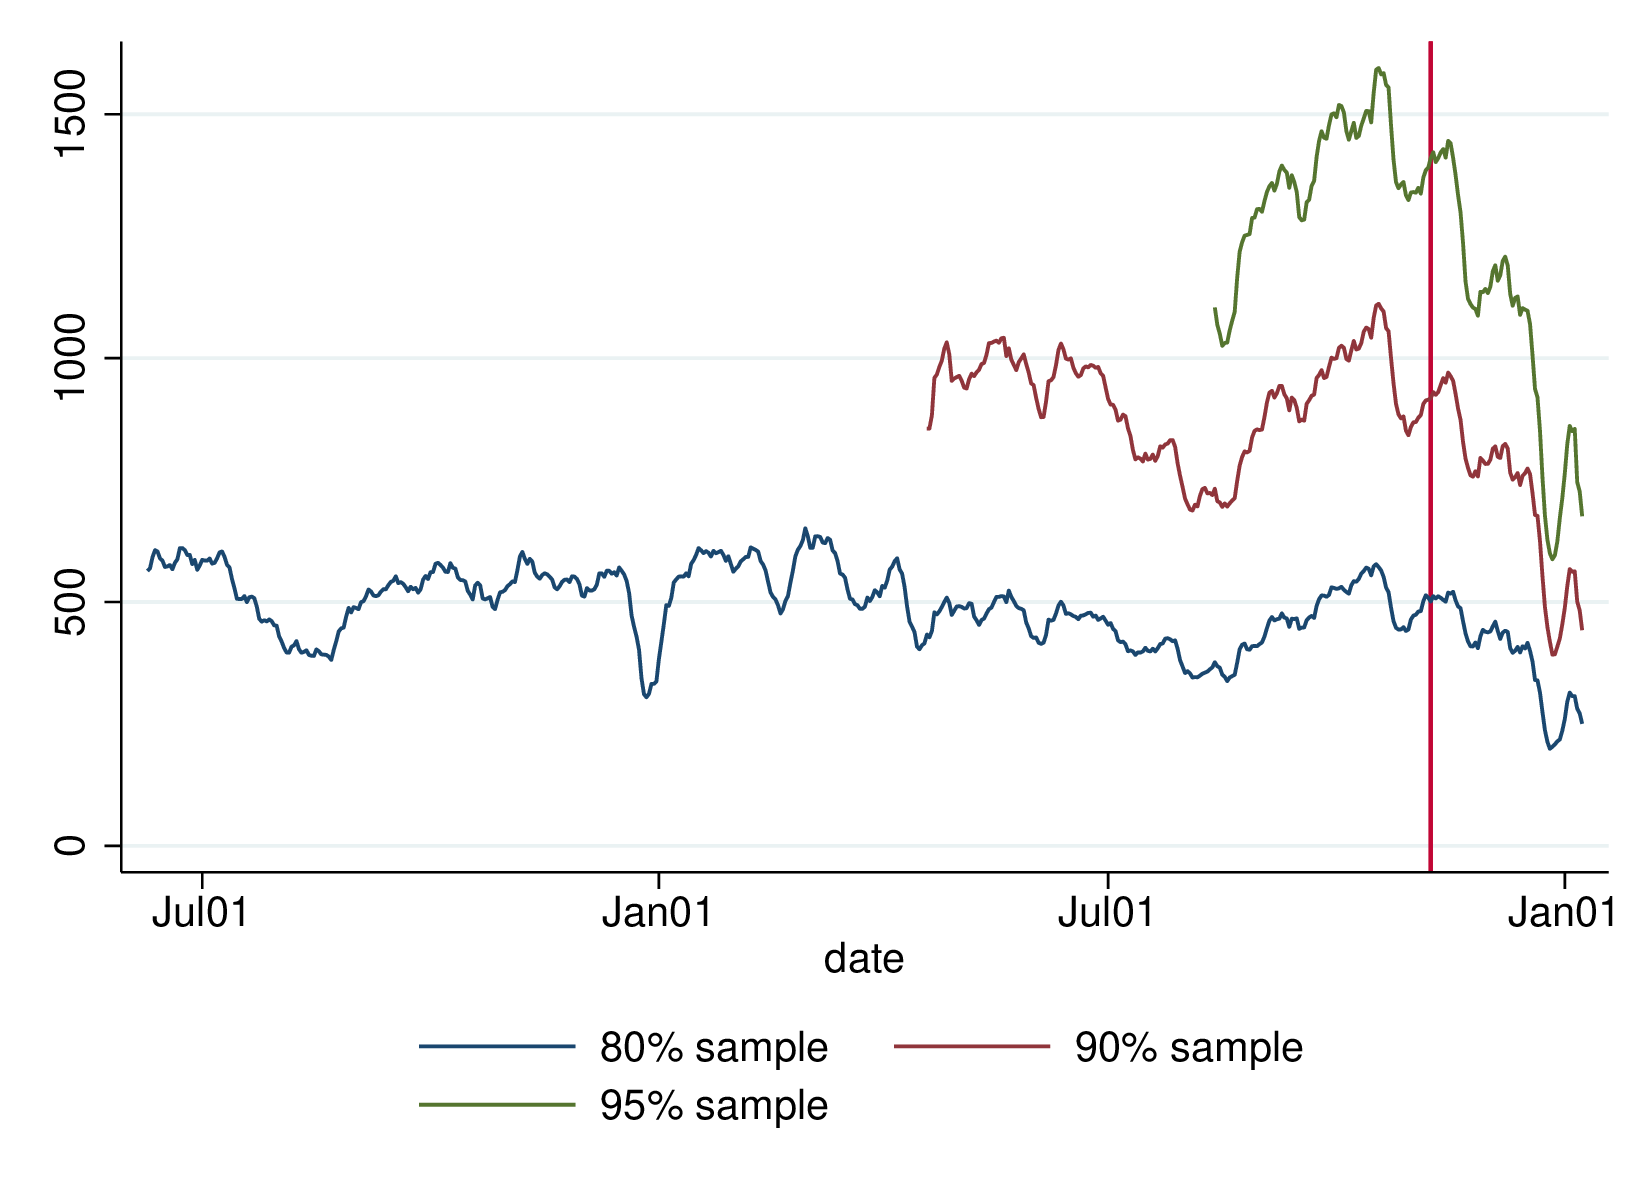
Figure 8: Twitter activity at 80, 90 & 95% samples, over maximal time period
Conclusion
This isn’t generalisable: it’s just data from a single timeline. And there are problems of inference using partial retrospective data to characterise change over time. And clearly Musk’s arrival is not the only source of volatility, so how much we can attribute to that is not fully clear. But taking that on board, there is still a pretty consistent pattern of decline since early November.
This is not evidence that Twitter activity in general has declined: there are new accounts, restored accounts, and extra activity on accounts that are cheered by the new ownership regime. It’s just a way of asking whether Twitter as viewed from my account has changed. The answer to that seems to be “yes, but lots of my tweeps are still very active”. Twitter isn’t going to die just because people like me are ignoring it.
To do:
- Re-collect data over the next few weeks, extending the inferences forward for the same account-list
- Re-do this exercise with another sample of accounts