The triangle inequality

I have a Stata program, metricp, which takes a distance matrix (square, symmetric, zero diagonal) and tests for the triangle inequality (that for all i, j, there is no k such that d[i,j] > d[i,k] + d[j,k]).

I needed something similar today in R, and found Matthew Vavrek’s fossil package, which includes a tri.ineq() function. However, it turned out to be very slow on the large matrix I threw at it, so I decided to speed it up with some of the techniques in metricp.ado.

Continue reading The triangle inequality

Comparing sibling and unrelated dyads: one or many?

Discussion

I had the great pleasure of acting as opponent for Aleksi Karhula’s successful PhD defence in Turku last Friday. Two of the papers presented in his PhD use sequence analysis to compare siblings’ lifecourses (Karhula, Erola, Raab and Fasang, and Raab, Fasang, Karhula and Erola, the latter already published in Demography), and I naturally found these particularly interesting. I have never done dyadic sequence analysis in the course of research, but I have written some code to deal with it using SADI, for teaching purposes. This note arises out of that experience, in reaction to Aleksi and colleagues’ approach.

Continue reading Comparing sibling and unrelated dyads: one or many?

Logit, Probit and the LPM

Simulating and modelling binary outcomes

When we have a binary outcome and want to fit a regression model,
fitting a linear regression with the binary outcome (the so called Linear
Probability Model) is deprecated, and logistic and probit regression are
the standard practice.

But how well or poorly does the linear probability model function
relative to logistic or probit regression?

Continue reading Logit, Probit and the LPM

Comparative perspective on migration from Eurostat population data

Migration is a big issue at the moment in Europe, not least in the UK
where public fears about migration (stoked by a racist press and a Home
Secretary and now PM who, let’s say, seems to have a visceral unreasoned
belief that the presence of foreigners in some way harms Britain) lie
behind the Brexit vote.

There are other reasons for being interested in migration, of course.
For instance, I’ve been wondering a bit about gender differentials in the age profile
of migration and re-migration. So I started looking for data, initially
on the Irish CSO site, where I found annual year-of-age
population estimates.

Continue reading Comparative perspective on migration from Eurostat population data

Bug in Stata’s dendrogram code

Binary treeDendrograms are diagrams that have a tree-like structure, and they’re often used to represent the structure of clustering in a hierarchical (agglomerative) cluster analysis. Agglomerative clustering starts from the bottom up, joining the nearest pairs of objects into clusters, and then clusters with objects and finally clusters with clusters, until eventually everything is a single cluster. The single cluster is the root, the objects are the leaves, and in between is a binary tree, where objects and clusters are combined depending on their distance from each other.
This process depends on being able to define a distance between an object and a cluster, and between pairs of clusters, and there are various ways to do this. However, some algorithms may cause the distance between an object/cluster and another cluster to change after the amalgamation of other clusters. This permits “reversals”, which are difficult or impossible to represent in a dendrogram-like structure. But clustering algorithms or “linkages” such as Ward’s are not subject to this problem.

OK, so far so good. What’s the problem? Stata’s dendrogram code is slightly buggy, and can give an error:
currently can't handle dendrogram reversals
even when you are using a linkage that is not subject to reversals. The explanation is that it is comparing distances between pairs of clusters where one must be greater than or equal to the other for the dendrogram to be drawable (otherwise it’s a reversal), and due to numeric precision is finding pairs where one is fractionally less. The correct code should test the difference in the distances is not less than a very small number (e.g., 10^-7) to take account of precision.

I have had a number of people report this error to me, in connection with my SADI Stata ado package, and have been able to reproduce it. In cooperation with some of these respondents, we have been able to get a work-around from Stata Technical Support (this bug persists into Stata 14).

The following command displays the information that Stata holds about the current clustering (apologies for the linewrapping):

. char list _dta[_clus_1_info]
_dta[_clus_1_info]: `"t hierarchical"' `"m wards"' `"d user matrix omd"' `"v id _clus_1_id"' `"v order _clus_1_ord"' `"v height _clus_1_hgt"'

A small change to this will allow the dendrogram to be drawn:

. char _dta[_clus_1_info] `"`"t hierarchical"' `"m wards"' `"d user matrix omd"' `"v id _clus_1_id"' `"v order _clus_1_ord"' `"v height _clus_1_hgt"'"'

Gender change in Irish political representation

Estimating the effect of the gender quota: The initial question

A gender quota for candidates was imposed in the 2016 Irish election (see e.g., http://www.thejournal.ie/readme/gender-quota). The question arises whether it had an impact. As a first pass consider the following table:1

           |        gender
      dail |         f          m |     Total
-----------+----------------------+----------
      2011 |        21        145 |       166 
           |     12.65      87.35 |    100.00 
-----------+----------------------+----------
      2016 |        32        116 |       148 
           |     21.62      78.38 |    100.00 
-----------+----------------------+----------
     Total |        53        261 |       314 
           |     16.88      83.12 |    100.00

This is clearly a big rise. Is it statistically significant?

Continue reading Gender change in Irish political representation

Pseudo-R2 is pseudo

People like the R2 stat from linear regression so much that they re-invent it in places it doesn’t naturally arise, such as logistic regression. The true R2 has nice clean interpretations, as the proportion of variation explained or the square of the correlation between observed and predicted values. The fake or pseudo-R2 statistics are often based on relating the loglikelihood of the current model against that of the null model (intercept only) in some way. There is a good overview at UCLA.

One of the most popular pseudo-R2 is McFadden’s. This is defined as 1 – LLm/LL0 where LLm is the log-likelihood of the current model, and LL0 that of the null model. This appears to have the range 0-1 though 1 will never be reached in practice.

It is well known that if we fit linear regressions by maximum-likelihood, we get exactly the same parameter estimates as if we fit by ordinary least squares. We can demonstrate this in Stata:

. sysuse auto
. reg price headroom mpg
. glm price headroom mpg

Since the ML estimation of the linear regression gives us loglikelihoods, we can calculate pseudo-R2 and true R2 for the same model. This code does it for a range of simple models with Stata’s demonstration “auto” data set:


sysuse auto, clear
glm price
local basell = e(ll)
local vars "mpg rep78 headroom trunk weight length turn displacement gear_ratio foreign"
local rhs = ""

gen r2 = .
gen mcf = .

local i 0
foreach var in `vars' {
local i = `i'+1
local rhs = "`rhs' `var'"
qui glm price `rhs'
local mcfad = 1 - (e(ll)/ `basell')
qui reg price `rhs'
di %6.3f `=e(r2)' %6.3f `mcfad' " : `rhs'"
qui replace r2 = `=e(r2)' in `i'
qui replace mcf = `mcfad' in `i'
}

label var mcf "McFadden Pseudo-R2"
label var r2 "R-squared"
scatter mcf r2

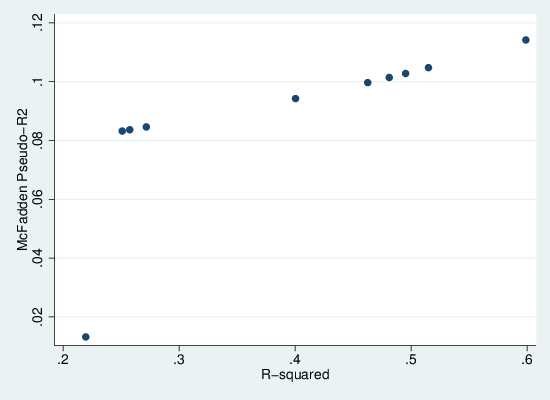
This generates the following graph, in which we see that there is a monotonic but non-linear relationship between the two measures. We can also see very clearly that pseudo-R2 is always substantially lower than R2. Thus it should be clear that while it emulates R2 in spirit, it doesn’t actually approximate it. So when people talk about proportion of variation explained in a logistic regression, shoot them down.

pseudo-R2 vs R2

Update on UCAS post

I had an interesting exchange by e-mail with Maggie Smith, the analyst at UCAS responsible for the note discussed in my previous blog entry. She tells me that the conclusion I derived from the released data (the small but significant ethnicity effect) is very much attenuated when the data is broken down by provider, and the published UCAS analysis is based on such disaggregated data. Continue reading Update on UCAS post